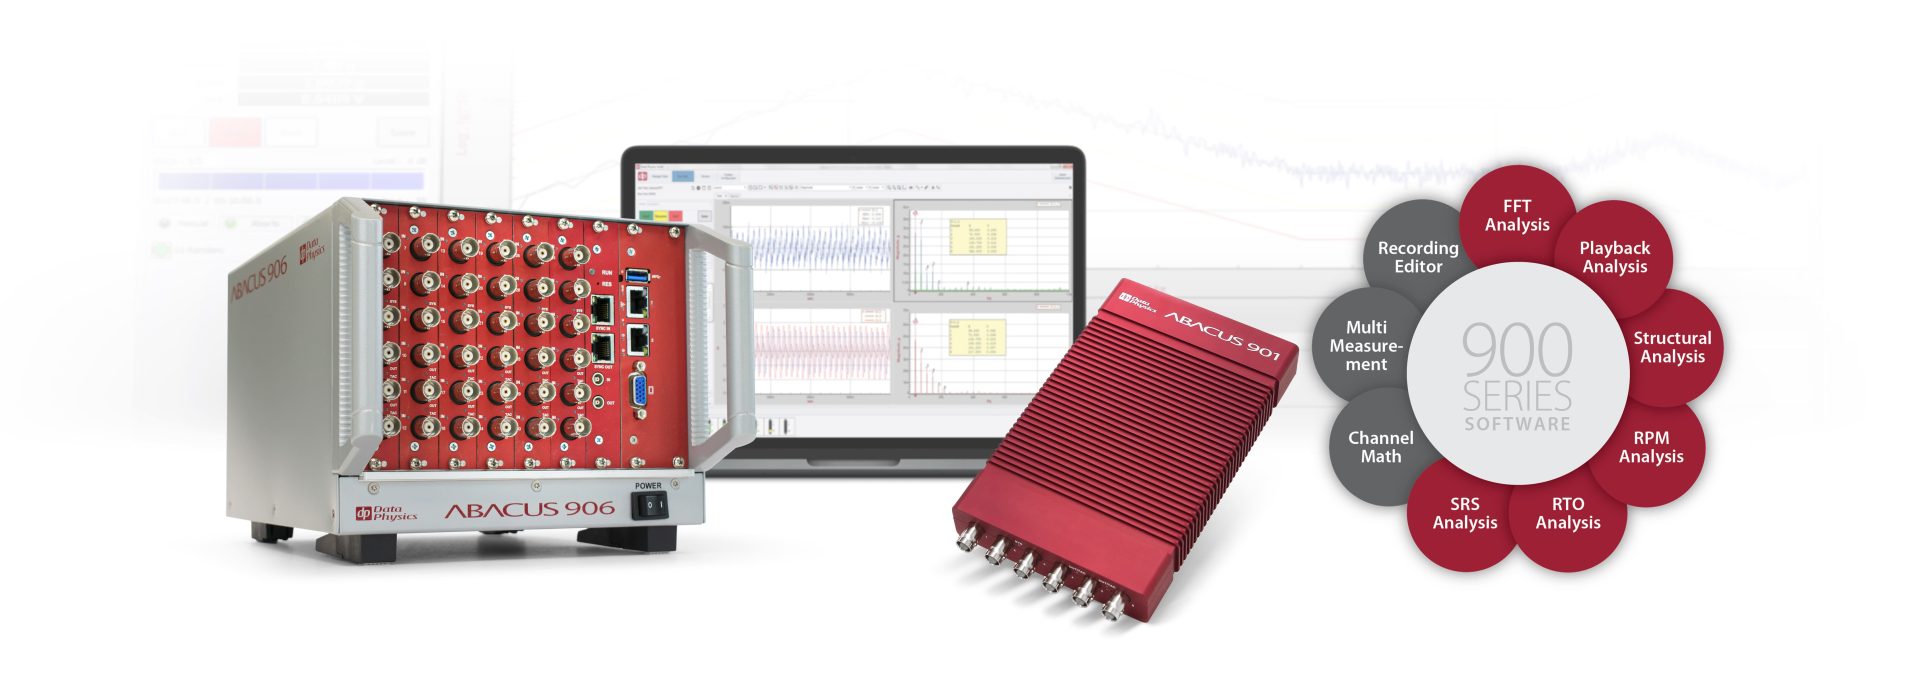
Comprehensive Dynamic Signal Analysis with Uncompromising Results
Used extensively in aerospace, automotive, defense, power, and process industries, dynamic signal analysis serves as a primary tool for vibration applications and other dynamic measurements including vibration surveys, model validation, acceptance testing, troubleshooting, and diagnostics.
FFT Analysis
Many dynamic measurements benefit from real-time analysis and results in the frequency domain. The Fast Fourier Transform (FFT) converts Time Domain to the Frequency Domain and is the fundamental analysis in understanding signal frequency content.
Frequency Domain – Display spectral information in different formats – Linear Spectrum, Auto Power Spectrum and Power Spectral Density (PSD)
Zoom Analysis – Enhance spectral resolution with the bandwidth of interest
Compare Signals – Overlay signals from different tests or runs; import external user signal for comparative visual reference or limit lines
Integration and Differentiation – compute velocity or displacement from acceleration, and vice-versa
Time data recording provides peace of mind if you have only one shot at a measurement. Data can be processed any number of times using different measurement techniques, eliminating the need to go back into the field.
Simultaneous Recording and Measurement – Measurements can be made during recording, reducing post-analysis time
Independent Recording Sample Rate – Recording sample rate can be different from the measurement sample rate
Circular Recording – Record only the last few seconds or minutes of the measurement, irrespective of the measurement time saving hard disk space
Multi Recorder – Record multiple time data streams simultaneously at independent sample rates and recording times
Automatic Exporting – Export recordings to Matlab, ASCII, UFF, DSF, CSV formats during measurement saving precious time
Analyze vibration measurements synchronized to the speed of the rotating shaft.
RPM Measurement – FFT-based fixed bandwidth technique ideal for steady-state or slow-changing rpm values
Synchronous Averaging – Measurement converges to the ideal values after canceling asynchronous noise
Order Tracking – Uses a resampling technique for synchronization to provide revolution histories and order spectra. Ideal for high and rapidly changing speeds
Demodulation – Computes amplitude and phase/frequency domain demodulation by computing the Hilbert transform
Waterfall Analysis – Combines rotation speed, amplitude, and orders on the same graph providing useful insights and patterns to help differentiate structural resonances from order-related vibration.
Octave Analysis provides Real-time octave, 1/3rd, 1/6th, 1/12th, and 1/24th octave band spectral analysis.
Filter Specifications – Analysis is implemented by digital filter banks that conform to ANSI S1.11 – 1986 ANSI S1.11 – 2004 specifications
Exponential Detector – computes a running average of the RMS value biased to the current input. Provides Fast (125 ms) or Slow (1 sec) time constants in accordance with IEC 651
Linear Detector – computer the true RMS value at each filter averaged over a fixed integration time
Sensor Calibration – Built-in sensor calibration function automates calibration of sound and vibration sensors