
Last Updated on March 26, 2024 by dpnew
What is Modal Analysis?
Modal analysis is the study of dynamic characteristics of a structure under test. The purpose is to identify the Modal parameters of the structure under test. Modes are inherent properties of a structure, and are determined by the material properties (mass, damping, and stiffness), as well as the boundary conditions of the structure. Each mode is defined by a natural (modal) frequency, modal damping, and a mode shape.
What is Modal Testing?
Modal testing is the process to measure structural frequency response functions (FRF). A user is responsible for selecting the right sensors, channel coupling, frequency ranges, etc., to acquire the system frequency response functions with high accuracy.
The structure under test needs to be excited and produce enough response across the measurement points on the structure under test. Typically, an impact hammer, single shaker, or multiple shakers can be used to excite the DUT in the lab. In the field, operational responses can be measured with no excitation force available for some tests.
Shaker excitation technique is discussed in detail in this article.
Structural Reciprocity
Structural Reciprocity states that response at point A due to excitation at point B equals response at point B due to excitation at point A.
With this theorem, the amount of data required to understand the structure is reduced. Simply put, only 1 row or column of Frequency Response Functions is needed, to represent the structure under test.
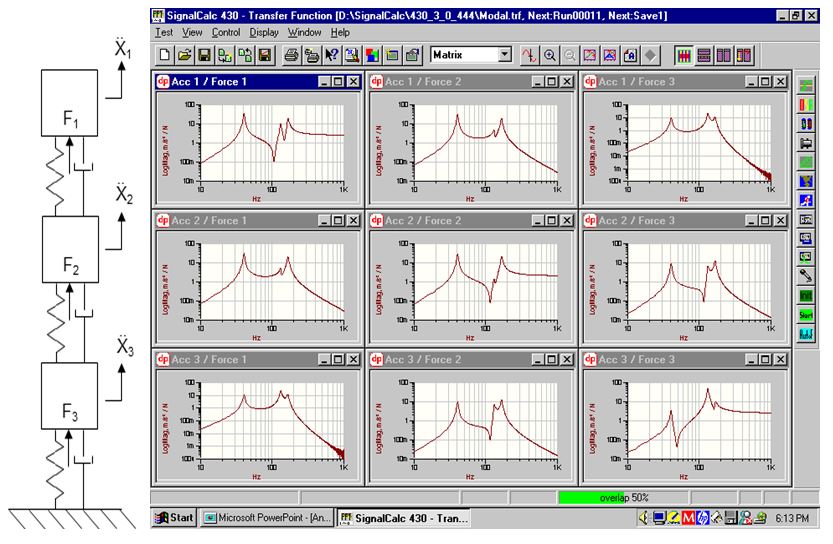
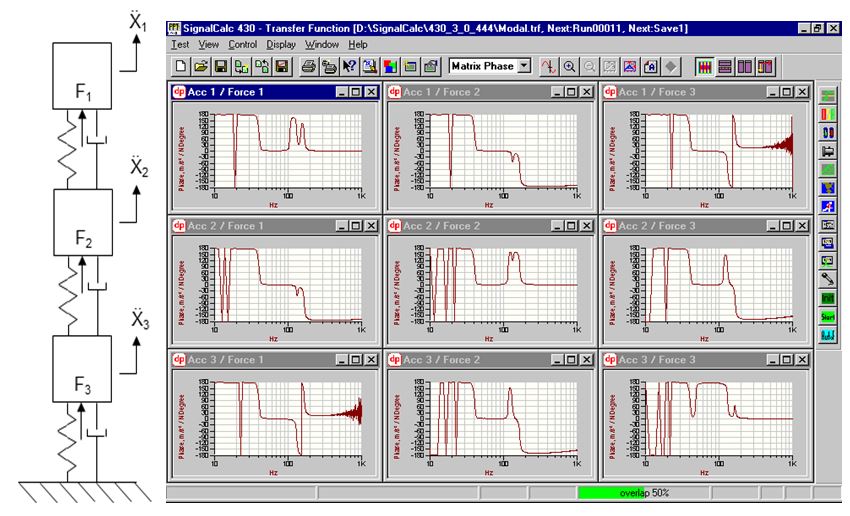
The figure above illustrates a 3 DOF lumped-mass model with all 9 possible Acceleration/Force frequency response functions. Note only the diagonal (driving point) measurements are unique. The lower figure illustrates the symmetry of Phase while the upper figure shows the magnitude symmetry.
Modal Testing With Shaker Excitation
As shown in below figure, the device under test is excited at a single point by a shaker and accelerometers are roved around the device under test to measure the corresponding responses.
DOF, or point and direction information, of the excitation (reference) and response points, are recorded for each Frequency Response Function. Automation helps to simplify bookkeeping. The DOF information is saved with each measured frequency response function. Thus each Frequency Response Function can be associated to the geometry of the structure with modal software, to perform mode shape animation later on.
Modal shakers are used for modal testing. They are relatively simple to attach to the structure under test. It can just hang from a flexible bungee cord or operate with floor support. Fixing a shaker for modal testing always takes work and time. However it is worth the effort because Frequency Response Functions can be quickly acquired with a high channel-count dynamic signal analyzer.
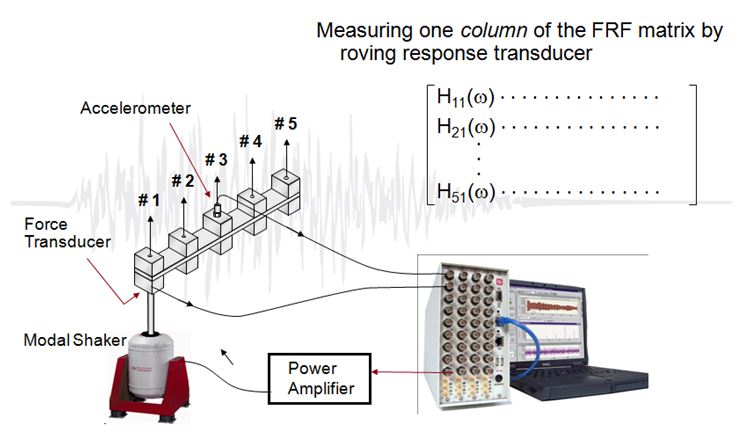
As illustrated in above figure, the test structure is excited with a determined excitation, and the associated responses are measured. The ratio of the Fast Fourier Transforms of these two quantities is the frequency response function Hij. This describes the response at point i when excited by a unit force at point j.
In a structure of which we want to describe the dynamic behaviour with n points, n different frequency response functions can be measured. Each measurement represents one degree of freedom. To completely describe the dynamic behaviour of the structure, it might be necessary to measure in the x, y, and z directions, in which case for n measurement points there will be 3xn degrees of freedom, and 3n x 3n different frequency response functions.
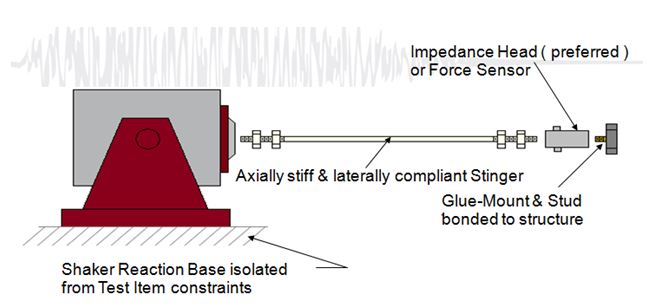
To transmit the excitation force, a stinger can be used, as shown in the figure above. Basically, the stinger decouples the shaker system from the structure and transmits driving force to the structure. The stinger itself is rigid in the axial direction and flexible in the lateral direction. The force transducer measures and transmits axial force into the structure through the transducer’s stiff casing. Therefore, any lateral loads transmitted to the structure by the stinger through the force transducer are isolated, and not measured. A properly designed, selected and aligned stinger will reduce potential noise problems.
Impedance Head is attached to the selected driving point at the structure under test. It is a force sensor and an accelerometer in one. It is very useful to measure excitation force and response at the driving point at the same time.
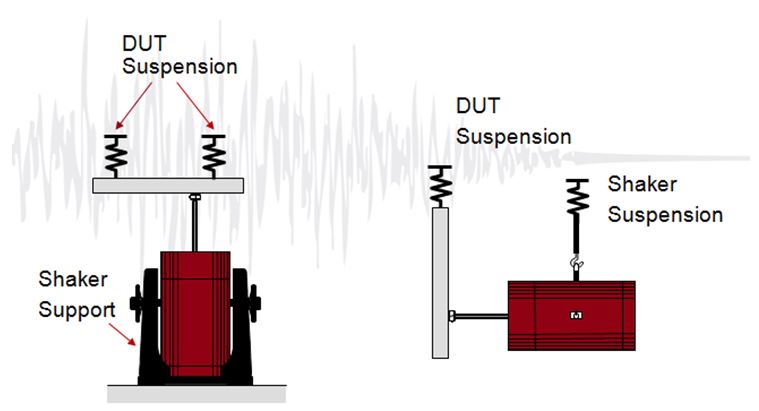
The structure under test is usually hung through flexible suspension, i.e., a bungee cord. This is a so-called free boundary condition. It is also possible to carry out a modal test with the structure under test under installation or operation conditions. The same types of boundary conditions can be applied to the shaker mounting.
The figure above to the left provides the reaction from the external support. The shaker is installed inside its trunnion and supported by the floor. This is more often used for a smaller to medium DUT when it is possible to support the DUT with flexible means like a bungee cord. However, it is necessary to make sure the shaker support is resonance free.
The figure above to the right provides reaction excitation through shaker inertia. This kind of mounting limits the force but additional masses may be added to the shaker in case more driving force is desired.
In general the above setups work only when the suspension frequencies are much lower than the lowest frequencies of interest for the modal test.
For modal testing purposes, all required information is around the resonance frequencies where the dynamic mass is small. This results in much lower requirements for the amount of force needed for the modal test. The idea is to get enough of a response level and enough signal to noise ratio from all measurement points. In this case there is no need for a very big modal shaker.
Different Types of Excitation Signal
With shaker excitation there are different types of signals to be used to excite the structure under test. Typically, the excitation signal can be random or sine.
A random signal is a signal where the amplitude and the phase of the instantaneous spectrum at a given frequency vary randomly from record to record. Therefore, through the averaging, it will give a linear approximation to the frequency response function of a non-linear system excited by a random signal. This is important in applications based on linear models.
Apart from its auto-spectrum, a random signal can be characterized by its amplitude probability density. The amplitude probability yields Gaussian distribution characteristics.
A random signal can easily be band limited to the frequency range of interest to obtain an optimum dynamic range.
The Hanning window should be used to minimize leakage in the analysis.
The most important advantage of random excitation is the fact that it gives the best linear approximation of a non-linear system. The crest factor is typically 3 to 3.5. A random signal excites all frequencies of interest simultaneously and therefore this technique is fast, overall. However, Leakage is the issue for random excitation. Thus, the Hanning window will be required, with averaging.
A burst random signal is a random signal weighted with a transient time window. The transient window must be synchronised with the analysis trigger. This can be achieved with the analyzer’s source trigger type. The length of the burst window must be made so that when it stops there must be time enough to allow the structure responses to decay. This is to prevent leakage.
Due to the random nature of the signal, the best linear approximation of the system can be attained in the same way as the Random signal. With the right percentage setting of the burst random signal, the resulting Frequency Response Function can be Leakage free. It takes about the same time as the random signal. However, the Crest factor is higher than that in a random test due to the contribution to the RMS value, which is limited due to the time window on the signal.
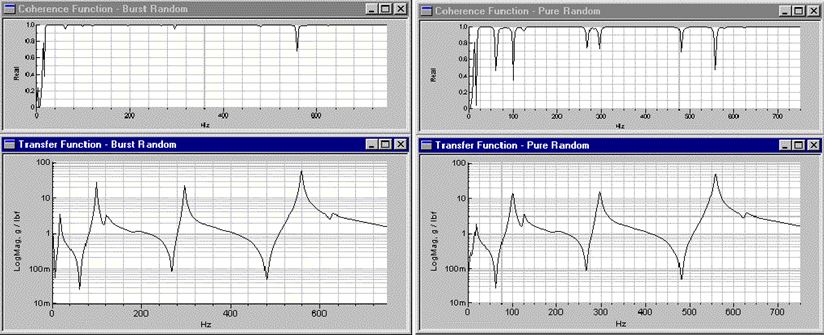
A lightly damped structure, when excited by pure random noise, will decay slowly. When an FFT takes a time frame of Force and Response, some motion is due to forces that were applied earlier than the captured frame. The force seen will stimulate reactions that continue past the current frame. This amounts to leakage and causes low Coherence around each resonance.
With Burst Random signal, it gates some random noise into a transient excitation. The reaction to the force to be observed in a single duration of the gate is much shorter than the capture window, allowing it to be included in one frame. This removes the leakage as shown by the improved Coherence, per the above figure. It is obvious that the coherence from the Burst Random signal excitation improved quite a lot, compared to that from the Random signal excitation on the right.
Also shown available is the Sine Excitation. For a Sine signal, the crest factor is 1.414, which is smaller than 2. This low crest factor value means that sine excitation is a good choice in situations where high peaks may cause problems. Sine excitation can be used to study non-linearity of the structure under test. For a given frequency, a number of measurements can be made, with different input levels.
A sweeping technique must be used to cover a broad frequency range. The sweep rate must be sufficiently low to allow the system time to respond to the changing frequency. Combining with the peak hold average, this is made possible.
There is also a Stepped Sine type of test available. With stepped sine test, the frequency response function is constructed by testing one frequency point at a time. Obviously, this type of test takes time. But it provides high accuracy results due to the fact that energy is concentrated at one frequency at a time.
The most important advantage of the Sine technique is the fact that it makes the study of non-linearity possible.
Chirp is a fast swept sine with a low and high frequency specified, all within one frame time, T. It basically has all the advantages and disadvantages of the “normal” pseudo random signal but with a lower crest factor.
Chirp signal has an ideal shape of spectrum: a flat magnitude spectrum and smooth phase spectrum. This is especially useful for the study of structures with non-linear behavior.
Final Thoughts
Modal testing technique with shaker excitation is discussed above in detail. Besides the topics discussed in this article, another concern is choosing the right Driving Point for Single Reference Point tests. In general, a few trial driving points can be tested. The purpose is to locate the right point on the structure to attach the shaker, in order to excite all the modes. The Driving Point Measurement is one of the most important measurements in test.
With the full set of Frequency Response Functions measured for a structure under test, the modal parameters can be identified using the Modal Analysis software package. Global parameters identified are Natural Frequencies, Damping and Mode Shapes.