Rotating Machinery Diagnostics and Vibration Analysis
Rotating Machinery Diagnostics and Vibration Analysis
Factory acceptance testing of large, industrial rotating machines often requires complete and accurate documentation of vibration characteristics including measurements for shaft and housing vibration analysis.
Previous slide
Next slide
Large Industrial Rotating Machinery Diagnostics
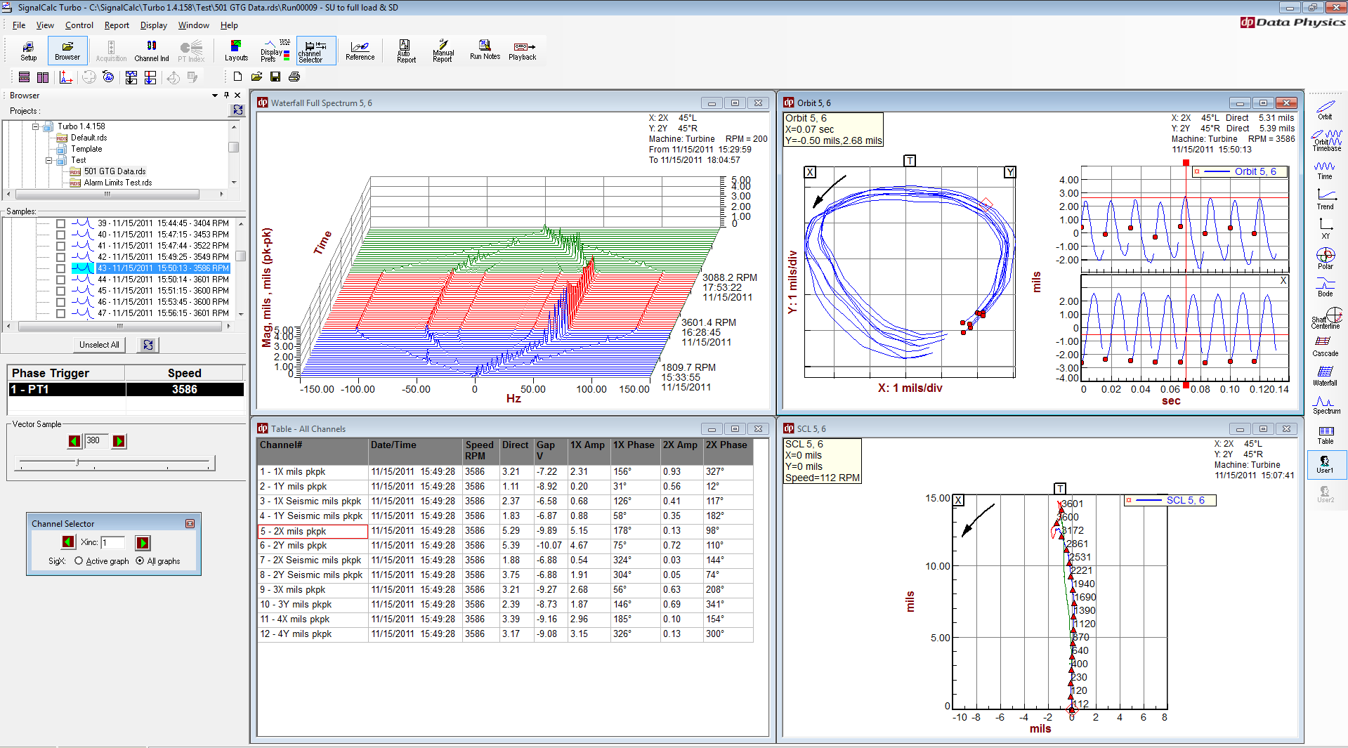
SignalCalc Turbo analyzer provides graphical measurement tools for analyzing fluid-film bearing machines. With a pair of proximity probes mounted on the shaft, a variety of diagnostic signals can be displayed to properly assess rotating machinery health.
Orbit Plots
Unfiltered or filtered 2D orbit plots
Orbit Timebase
Filtered or unfiltered time domain displays
Trend Plots
RPM, Amplitude, Phase, and more vs. Time
Polar Plots and Shaft Centerlines
Shaft Centerline, or filtered Polar Plots
Bode Plots
Filtered and unfiltered Bode plot
Waterfall / Cascade Plots
RPM based waterfall displays
Table Values
Filtered amplitude/phase vs time
Machinery Structural Analysis
Rotating machinery dynamics are best understood when structural and rotary dynamics are considered. With RPM measurements available throughout all structural analysis applications, SignalCalc 900 offers a robust solution to analyzing complex rotating machines and their supporting structures.
RPM Measurement
Measure RPM accurately with the high speed tachometer hardware
RPM Triggering
Trigger measurements based on RPM or RPM increments to collect steady state or ramp-up/ramp-down data
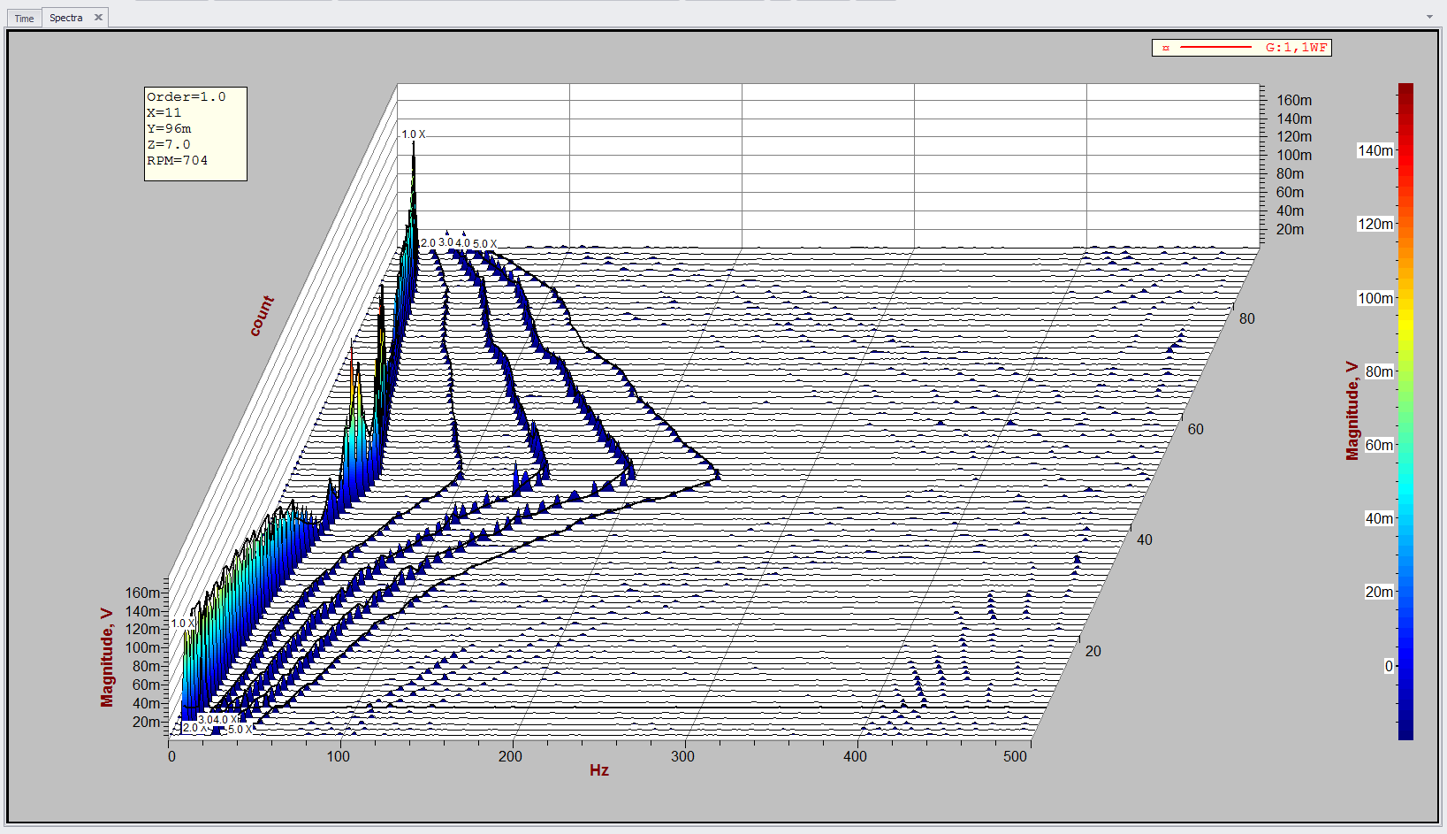
RPM based 3D plots
Visualize structural resonances and their excitation caused by rotating machines on 3D Waterfall or other plots
Automotive test engineers use order tracking methods to evaluate both rotating components and vehicle drivelines. Order tracking easily separates forced vibrations caused by the revving engine from the structural response of resonances.
Order Normalization
Specify RPM range of interest, the max order, and the desired delta order and the system automatically selects the propper measurement parameters.
3D Plot Visualization
Choose from waterfalls, color mesh, color cascade, campbell plots, spectrograms, and more.
Simultaneous FFT Measurements
Simultaneously run FFT measurements (multi-measurement) to take FFT based and RPM based measurements simultaneously – no need for post processing