The SignalCalc 900 Software's Reporting Engine is Based on Microsoft Word and Allows Complete Control of Your Report Template
With Custom Reporting, you can create a what-you-see-is-what-you-get template in Microsoft Word and have the SignalCalc 900 Software fill in the template – resulting in a 100% custom report that you can hand to your customer. What used to take hours now takes just a few seconds.
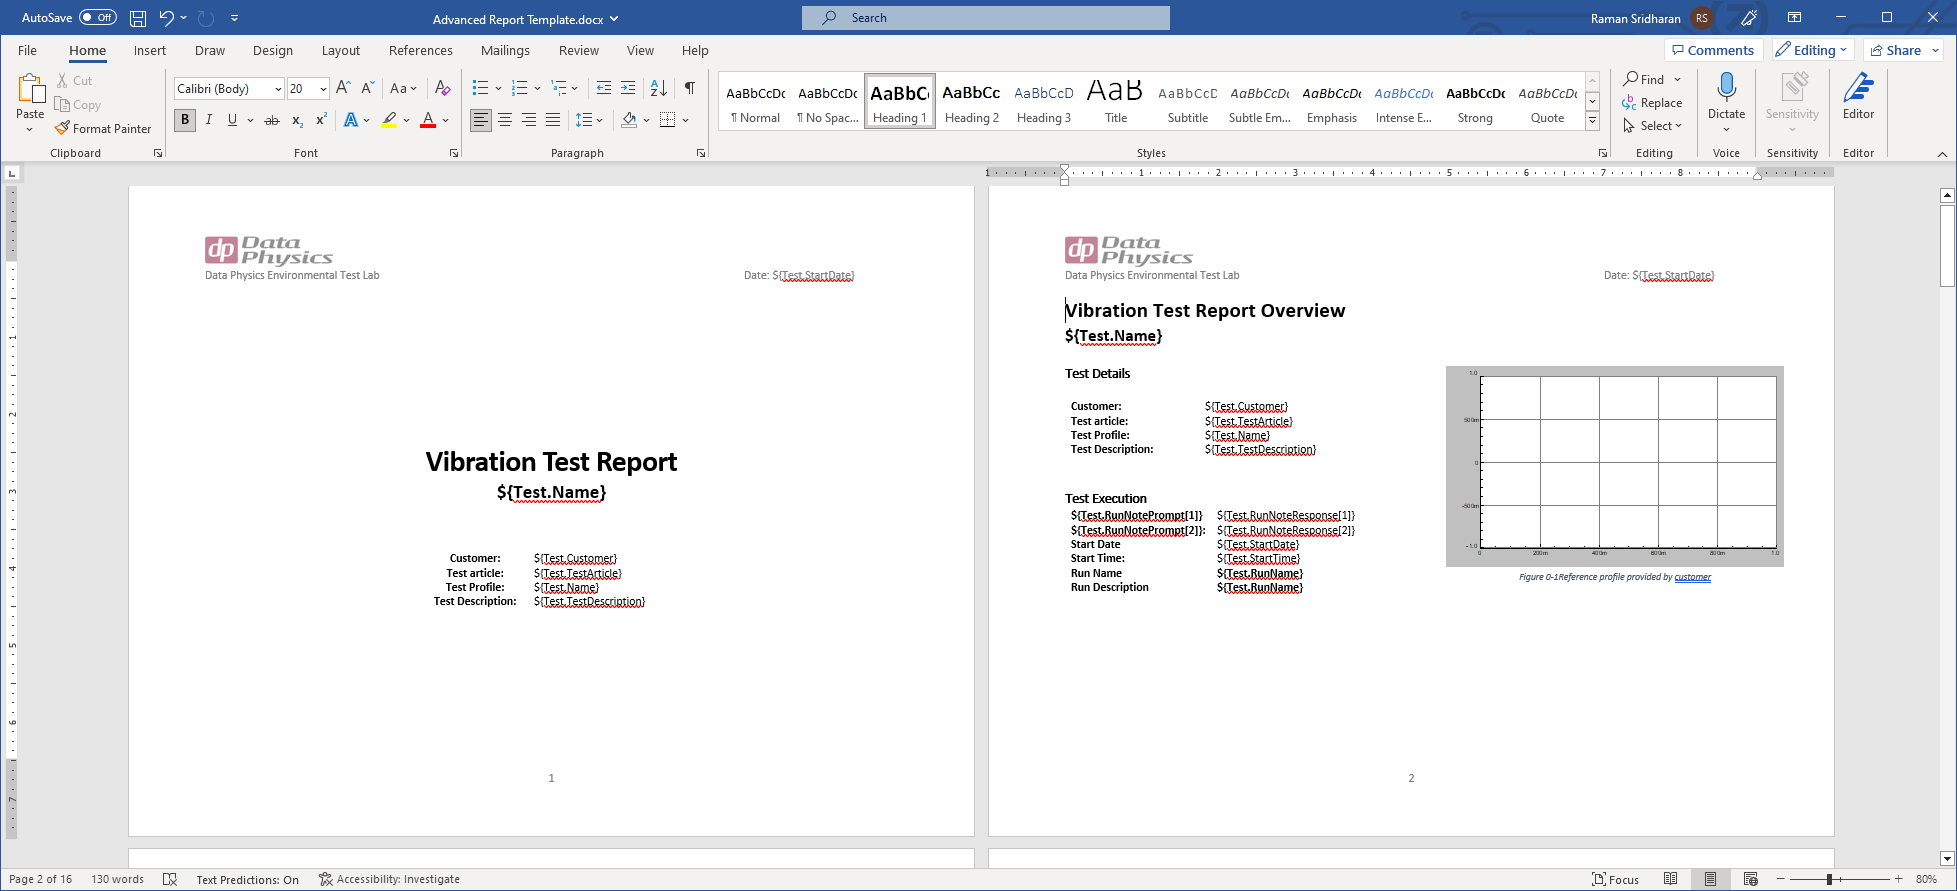
Generate Custom Report Templates in Word
What you See is What you Get
Create your template in Microsoft Word, using your own fonts, text sizes, and Word features like Table of Contents and headers/footers
$Variables for Test Parameters
Test setup parameters, stats, and control result parameters have a $variable that can be placed in the report.
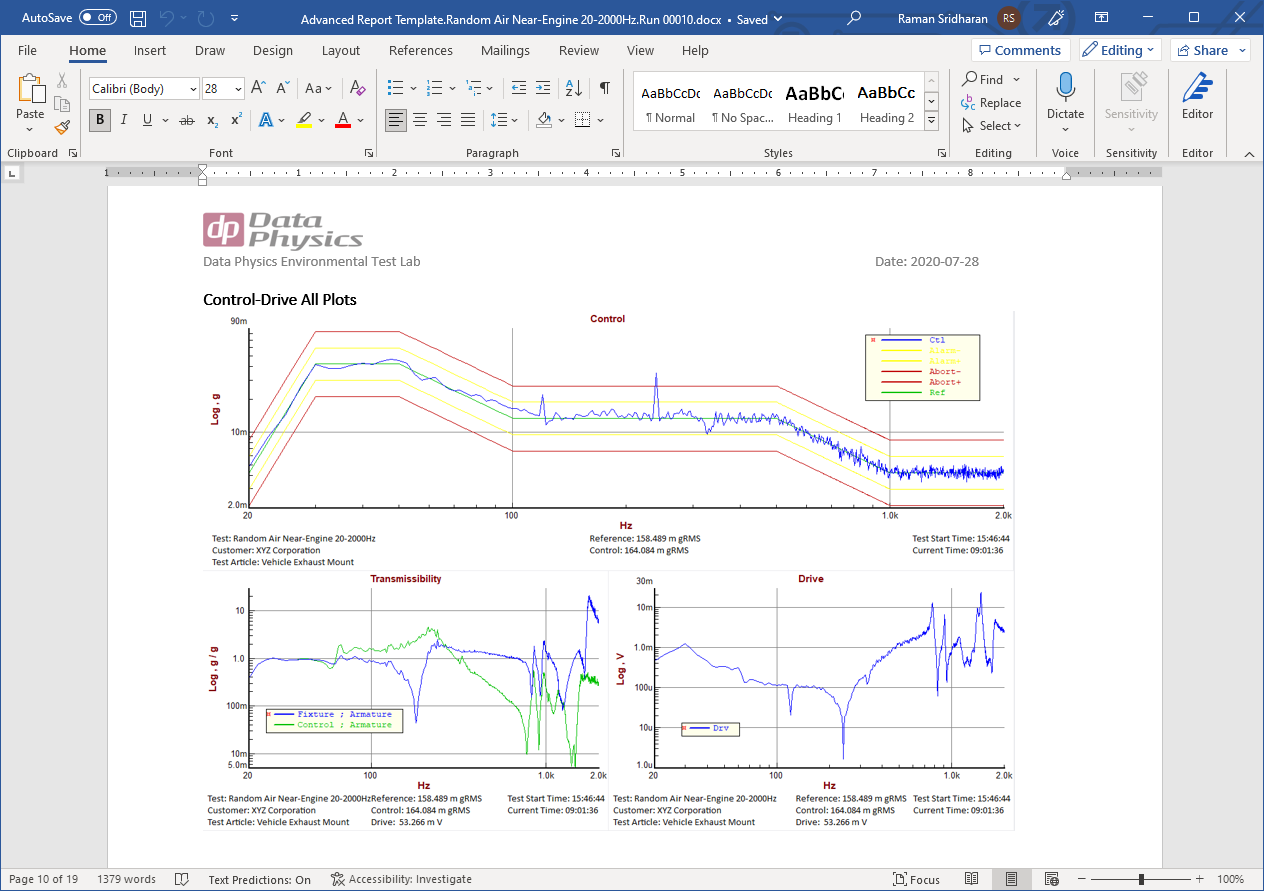
Placeholder Images for Plots
Use placeholder images for plots – placing and sizing them in the document. Placeholder images’ metadata is used to specify which plot goes into each placeholder image.
Specify Which Plot goes Where
Plots can still be fully customized in the SignalCalc software – and are automatically resized when it is pasted into the template.
Images in Reports
Images attached to the test or run can be called by a placeholder image in the report template, similar to a plot.
Watch the How-To Video:
From Profile Setup to Report – Streamlined Shaker Testing with the 900 Series Controller
We’ll cover topics such as how to:
Quickly and easily configure and run a sine/random profile
Attach images of your test article to your test data
Overlay data from various tests
Generate quality, customized reports — ready to deliver to customers
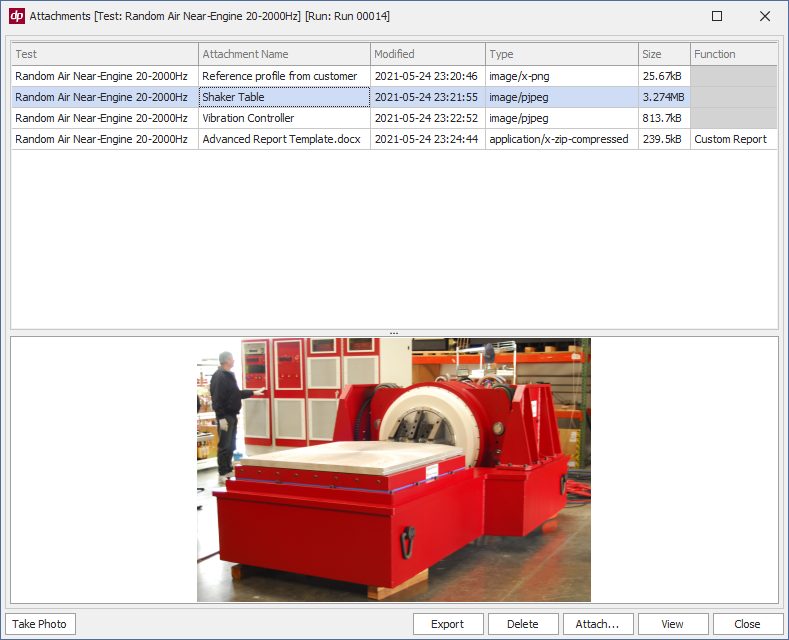
Images and Media Archived with Your Data
Attach Media to your Test
Images, documents, and other digital files can be attached to a Run, a specific Test, or a Project (set of tests).
Images and Media Archived with your Data
Images taken during the test is placed in your database, and is linked to the test data from which it was recorded.
Images in Reports
Images can be placed in standard reports automatically – and can be placed in custom report templates as well.
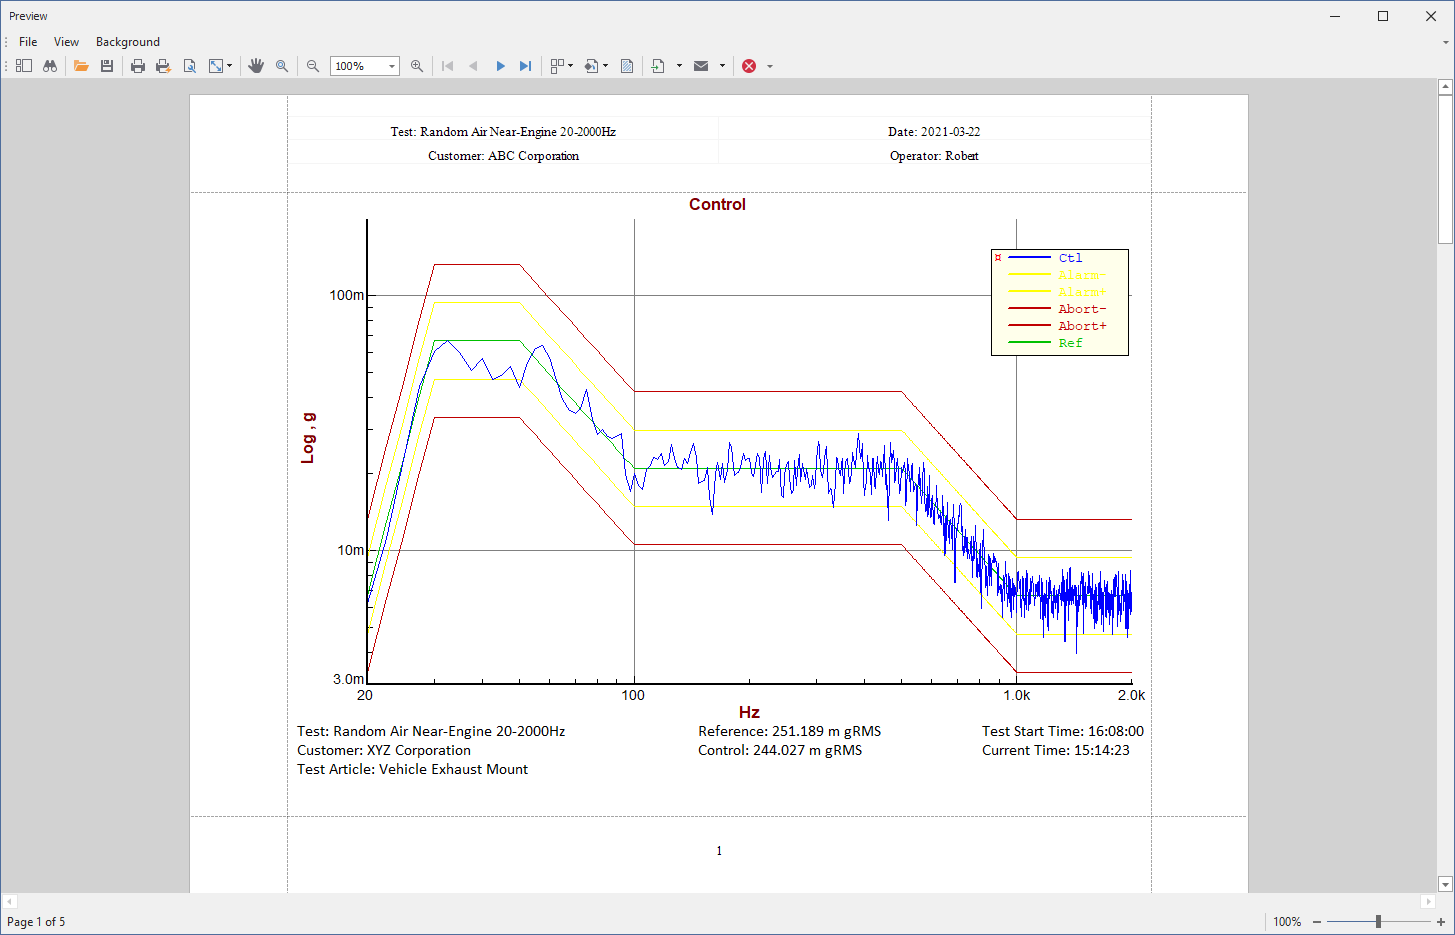
Standard Quick Report
Included with Every System
Quick Report is included with every Analyzer and Controller
Place Custom Plots in Report
Your plot or plots can be automatically placed in your report – you can select which plots and how many plots per page
Export to Word or PDF
Automatically export to Word or PDF, or append your report to an existing Word document. Microsoft Word need not be on the PC.
Test Parameter Output
Decide which test parameters end up in your report
Images in Report
Any images attached to the test or run can be automatically placed in the report