SRS Shock Control is used to Simulate
the Complex Vibration Environment Seen in
Earthquakes and Pyrotechnic Shock
SRS Shock Control synthesizes a time history that conforms to the given SRS reference. The SRS controller is the optimal controller choice for high frequency shock control, and has the ability to make independent SRS or Frequency domain measurements while the SRS controller is running – with SRS parameters independent of the controller SRS
Try the SignalCalc 900 Series Software for Free
Explore the power of the SignalCalc 900 Series software – with no hardware required. Run simulated tests, review results, and generate reports exactly as you would in a live environment.
Data Acquisition • Signal Analysis • Vibration Control
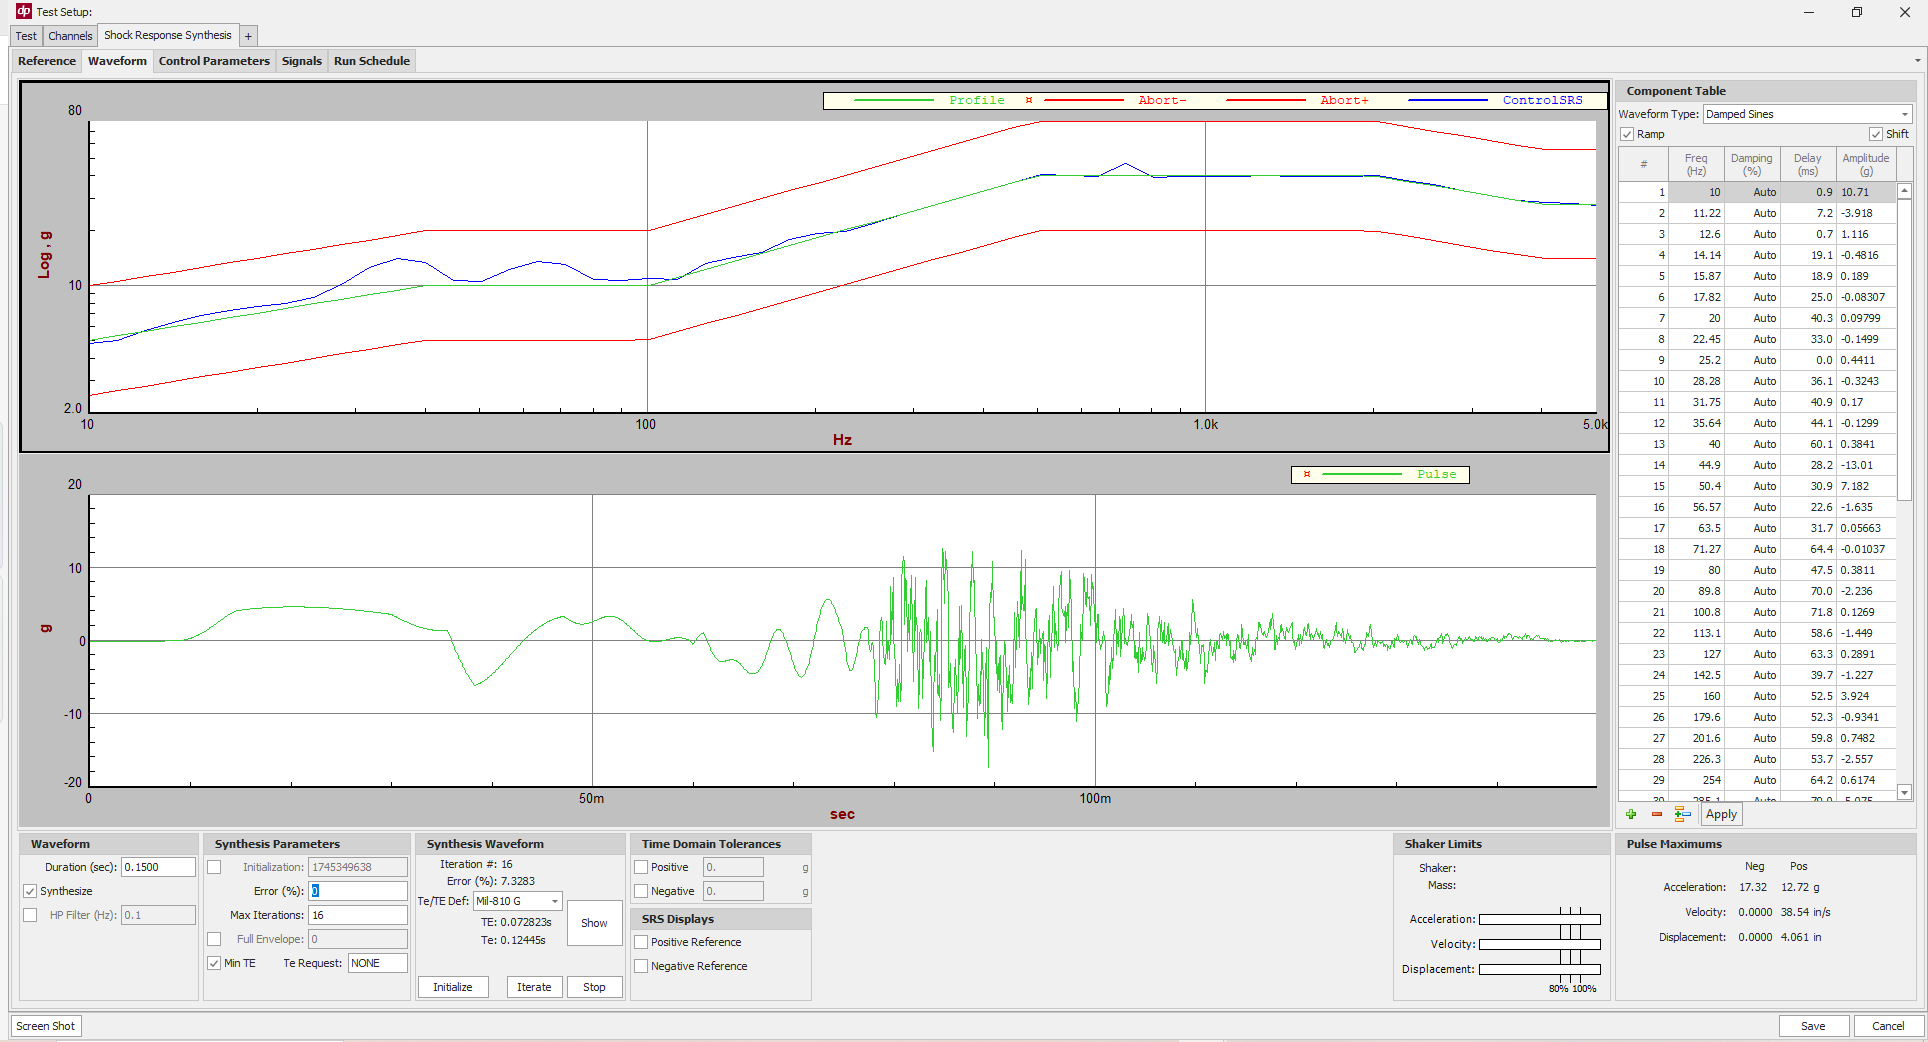
SRS shock breakpoints are entered in a table, or can be imported/pasted in from another application
Waveform Generation
Generate a waveform that conforms to the SRS reference, with a user-defined duration
Wavelet Types
Damped Sine, velocity/displacement compensated damped sine, Random, or Sine Beats wavelet types
Editable Wavelet Table
Wavelet table can be copied/pasted to/from other applications; and additional wavelets frequencies can be added
Minimize TE
Minimize TE algorithm can be applied when generating time waveform, and display TE/Te for Mil-810 D through H.
SRS Max/Pos/Neg Display During Setup
Display the Max/Pos/Neg SRS reference while setting up the reference SRS pulse
Velocity or Displacement Computations
Math Channels (gap free) can be used to compute the velocity or acceleration of any accelerometer; or combined math across multiple accelerometers
Eliminate waveform offset
Apply a highpass filter to eliminate any offsets in the generated pulse
Features for the Power User
Use Your Own Damped Sine Table
The software allows you to forego generating the pulse from the SRS – and instead will allow you to enter your own SRS profile and wavelet table
Copy/Paste the Damped Sine Table
Copy and paste the damped sine table to/from Excel or other application to easily define your own custom SRS pulse
Time Domain and SRS Tolerances
Abort the test based on a time domain tolerance excursion from the reference waveform; or because of an excursion in the SRS of your control channel
Advanced SRS Control and Measurement
High Frequency SRS
Band limit the shaker drive to run an SRS test to a higher frequency than the shaker is capable of exciting
Secondary Measurements
Run secondary, independent SRS Measurements live during test, and recompute the SRS live during test with different parameters (min/max freq, 1/n octave, damping, etc)
Manual Controls
Increase shock level manually before running the full test schedule. This helps ensure that control is optimized before running full level pulses
Stored Drive
Correction can be turned off once a desired drive signal is obtained (stored drive)
Custom Reports and Data Review/Export
Fully Customizable Plots
Include readouts including test parameters, customer and test article name, operator, test time, etc
Overlay Data
Data from one or more runs can be overlaid in Review Mode within seconds. The overlaid plots can be placed in a report.
Data Export
Pulse data can be exported automatically at the end of a test.
Create Custom Report Templates in Word
Create a report template in Microsoft Word and have SignalCalc 900 populate the report parameters, plots, and images automatically after each test (DP900-68)
Images and Media
Attach images of the test article or setup and have them printed in the report
Generate Reports Anywhere
Generate Reports on the PC that conducted the test, or on any networked PC