
Rotating Machinery Analysis
Analyze Vibrations Caused by Rotating Machinery by Triggering or Normalizing Data Based on the Rotating Speed of the Machine
RPM Analysis provides measurements synchronized to the speed of a rotating shaft. A high speed tach channel reads the RPM from the tachometer signal, and it can be used to trigger measurements or to pace waterfall displays.

RPM Detection Modes
RPM Sweep
System continuously monitors rpm during a ramp-up or coast down and triggers measurements based on a specified RPM interval
RPM Stepped
When the shaft reaches the specified rpm, system performs an averaged measurement reducing the signal noise
RPM Steady
Measurements are taken when the shaft speed is within a specified rpm band. Useful for monitoring a shaft that is drifting around a specific rpm
RPM Delta
Mode is similar to the RPM Sweep mode but allows for abrupt changes in sweep direction
Auto and Multi Tach Support
System automatically detects rpm information from a single or multiple tachometer channels; pacing and synchronous triggering can be enabled on the same channel or on different tach channels
Data Export
Export to ASCII/CSV, MEscope, UFF, SDF and Matlab
Rotating Machinery Analysis Options
RPM Measurement
FFT-based fixed bandwidth technique ideal for steady state or slow changing rpm measurements
Synchronous Averaging
Process removes the contribution of asynchronous vibration sources from a time or linear spectral average
Automatic Start and Stop Recording Using Events
Event-based start and stop recording ensures that the desired data is captured
Demodulation Measurement
Computes amplitude and phase/frequency domain demodulation by computing the Hilbert transform. Useful when signals of interest are mixed with other signals as modulation of frequency or amplitude
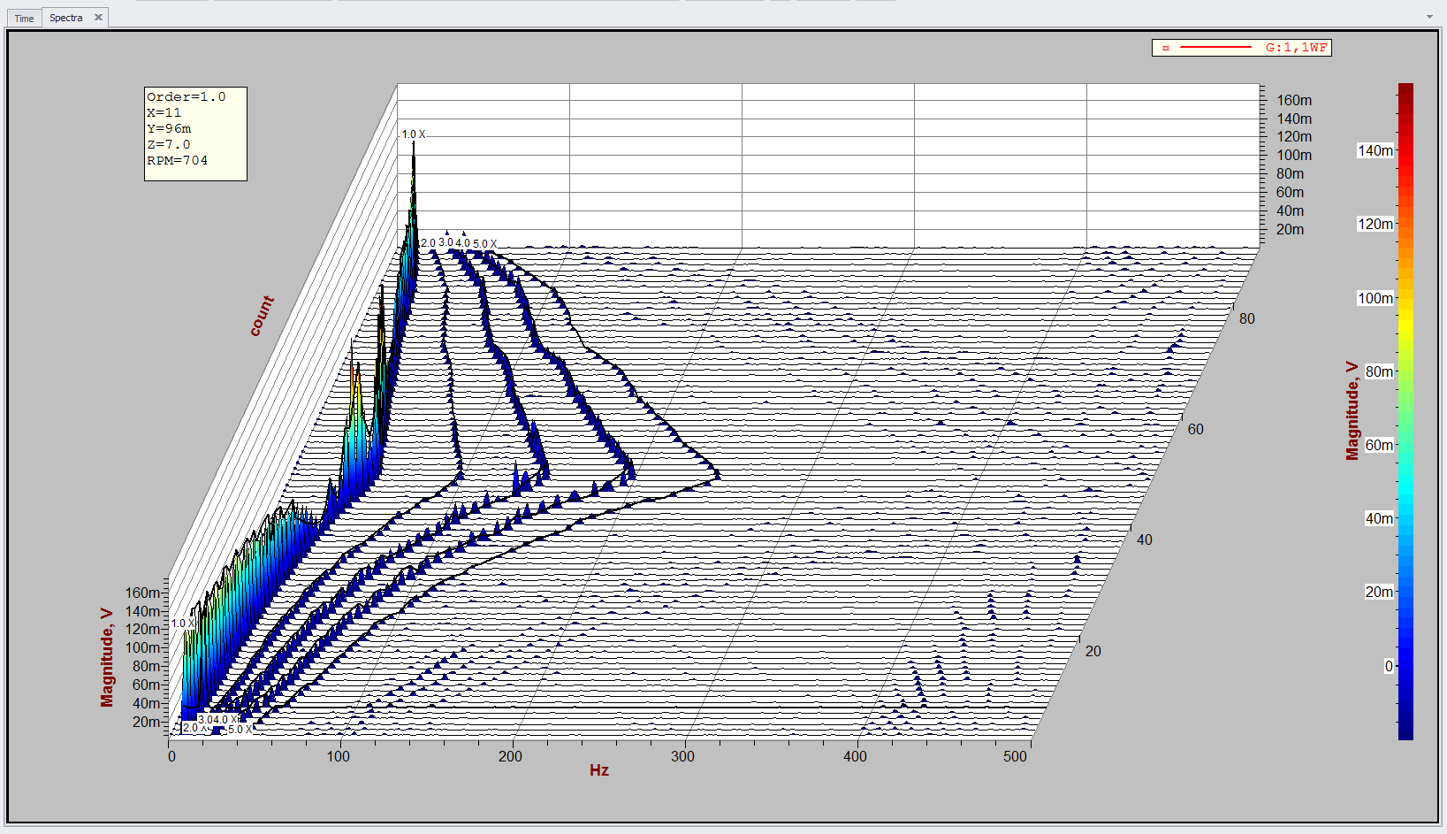
Waterfall Analysis
Waterfall analysis combines rotation speed, amplitude and orders on the same graph, enhancing data clarity; helps differentiate structural resonances from order-related vibration
Order Tracking Measurement
Uses a resampling technique to synchronize the sampling of input signals to the instantaneous angular velocity of the machine, providing revolution histories and order spectra. Ideal for high speed, rapidly accelerating or decelerating measurements
Custom Reports and Data Review/Export
Fully Customizable Plots
Include readouts including test parameters, customer and test article name, operator, test time, etc
Overlay Data
Data from one or more runs/saves can be overlaid in Review Mode within seconds. The overlaid plots can be placed in a report.
Data Export
Data can be exported automatically during or after a test
Create Custom Report Templates in Word
Create a report template in Microsoft Word and have SignalCalc 900 populate the report parameters, plots, and images automatically after each test (DP900-68)
Images and Media
Attach images of the test article or setup and have them printed in the report
Generate Reports Anywhere
Generate Reports on the PC that conducted the test, or on any networked PC

Efficient Testing, Analysis, and Reporting

1 Waterfall Compression
Allows data compression along the X-axis and/ or the Z-axis for faster waterfall displays. The choices are All, Every Nth, Max Nth, Min Nth, Average Nth and Auto. Compression applied is displayed in the WF legend.
2 Waterfall Formats
Waterfall plots can be displayed in different formats color cascades, surface maps, spectrograms, color mesh or Campbell diagrams.
3 Waterfall Child Window
Allows the user to examine each individual
spectrum or order plot in detail, overlay multiple traces and compare them against maximum or RMS amplitude values as a function of shaft rotating speed or order.
4 RPM Axis
Z-axis on the WF graph can be customized to display rpm, count or time.