SignalCalc 900 Software Suite
The 900 Series Signal Analyzers and Vibration Controllers are driven by the SignalCalc 900 Software. The 900 Series Software Suite is a clean, unified application for all signal analysis and shaker control applications
Built on modern software technologies such as a relational SQL database and a 64 bit architecture, the 900 Series Software simplifies the process of acquiring/processing data and generating a report. The well-planned user interface is simple to learn and the similarity between all data acquisition and vibration control applications minimizes the learning curve to get the most out of your 900 Series hardware.
More Advancements and Enhancements Designed to Improve your Test and Measurement Performance
Significant changes and enhancements have been included in this release of the SignalCalc 900 software.
Access the Comprehensive 2.1 Release Notes
A Brief Overview of the New Features and Enhancements:
Improvements to SRS Synthesis and Control
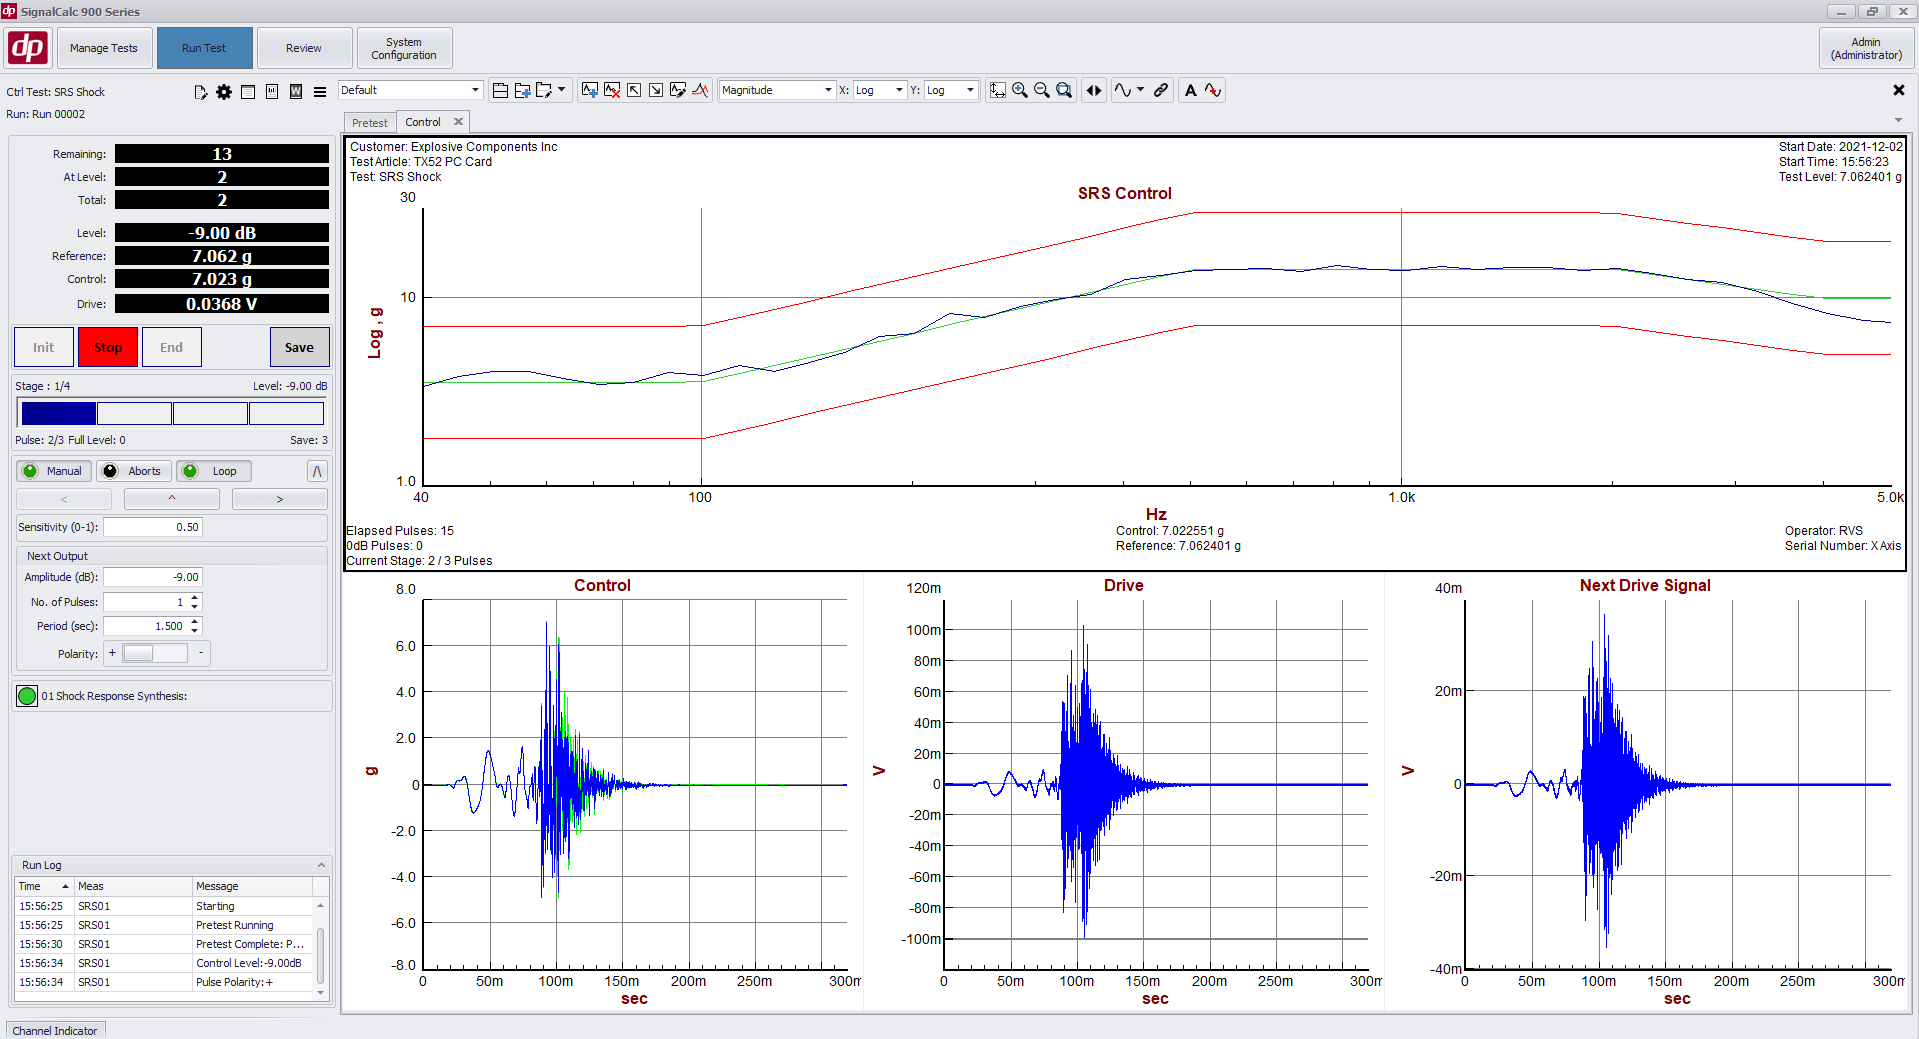
Numerous improvements have been made to SRS Synthesis and Control, including the addition of time domain tolerances, copy/paste ability, and the ability to easily enter wavelets as a profile.
Change Output Waveform Parameters (Frequency, Level, Offset) During a Live Measurement
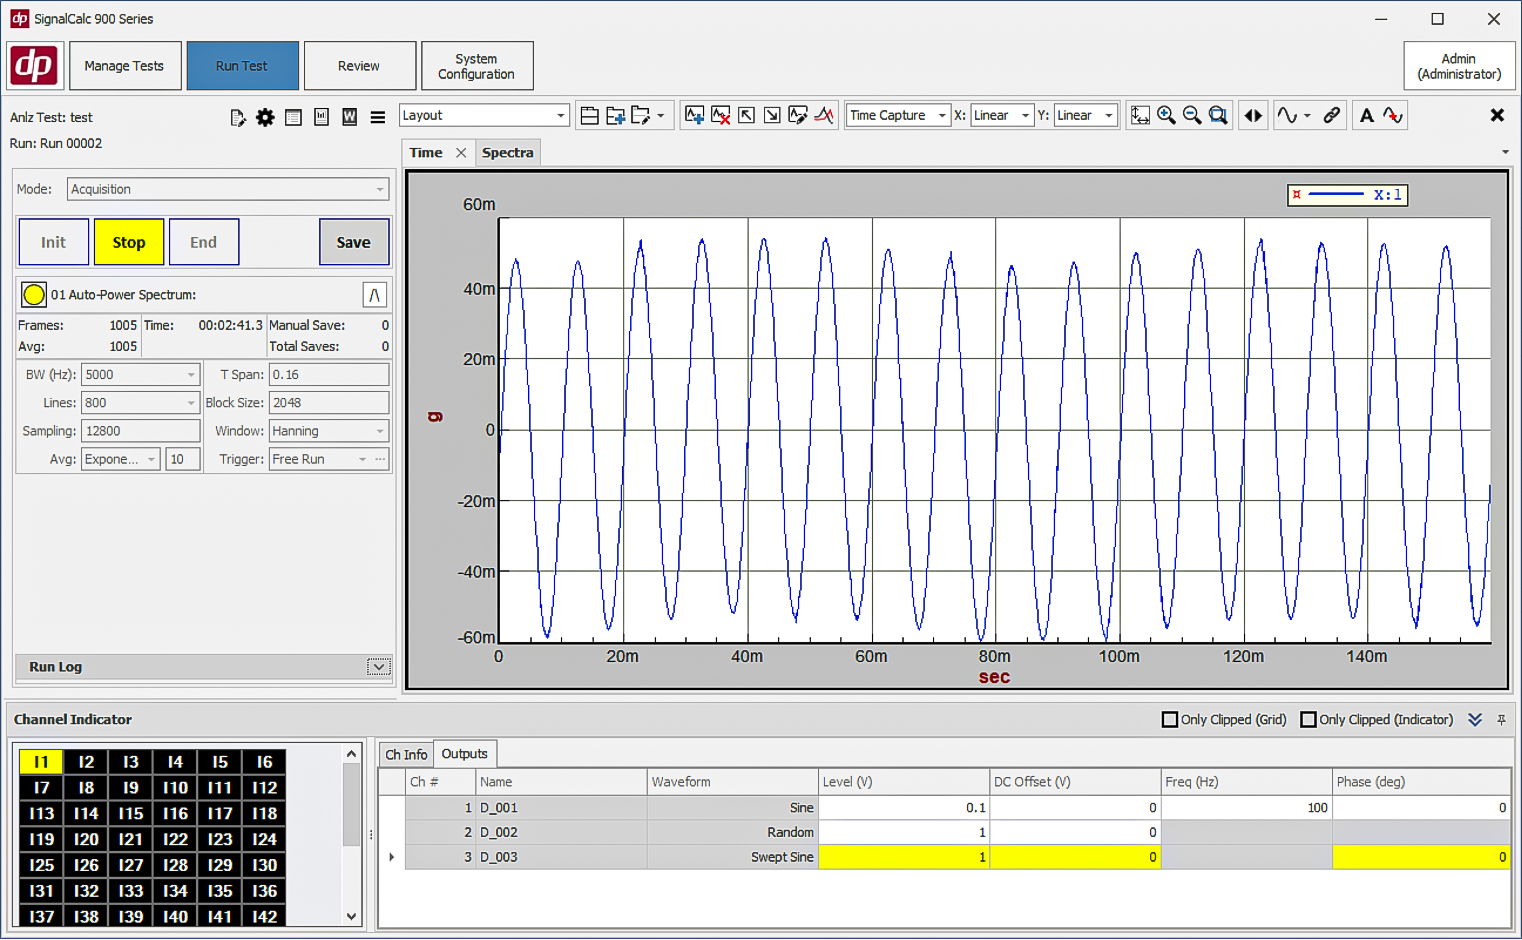
The ability to change the parameters of an output signal (e.g., a generated sine wave) live during the test has been added to SignalCalc 900. While running the test, the functionality appears at the bottom of the screen, in the Channel indicator’s output tab, as shown below.
Limiting in Mixed Mode (Sine/Random on Random)
The ability to limit in a Mixed Mode test has been added. A channel can be selected as a Limit channel in the Channels table; and a limiting PSD profile can be defined for the channel. During the test, the system will lower the drive to ensure the Limit channel’s PSD does not exceed its defined limit reference profile.
Importing SignalStar Scalar/Vector (700 Series) Tests into SignalCalc 900
The ability to import Random, Sine, and Classical Shock tests from SignalStar Controller has been added to SignalCalc 900. Tests parameters, profiles, and graph layouts are ported into SignalCalc 900 test and saved in the test database. In addition to this, signals and data taken on a SignalStar controller can be opened, viewed, and overlaid with new test data.
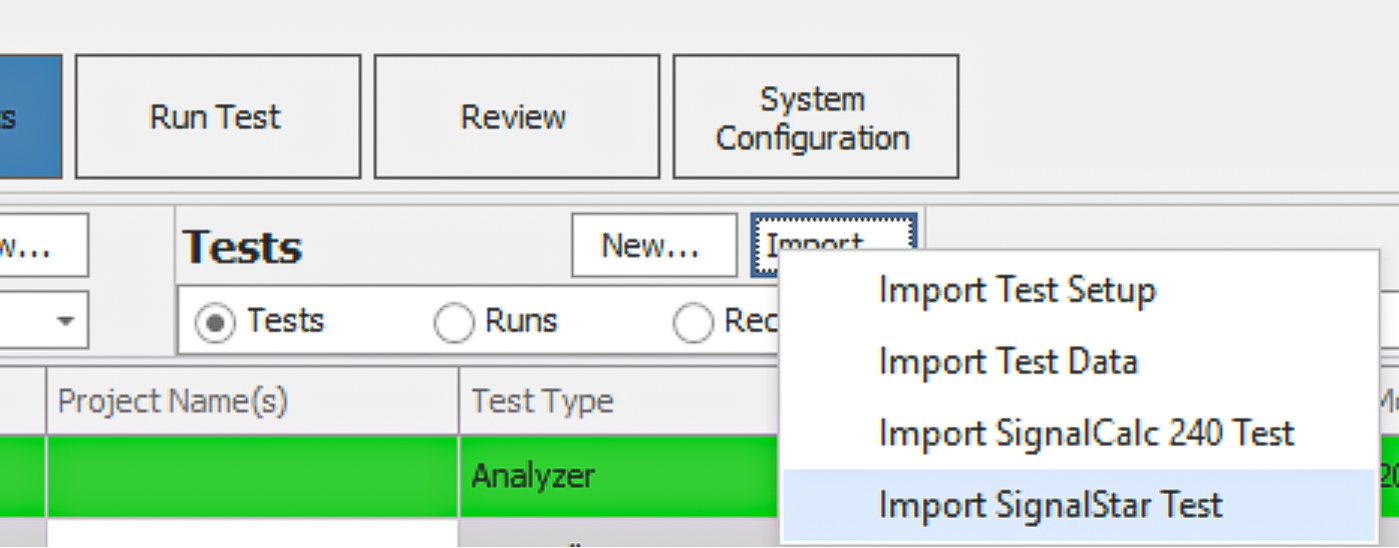
Importing test setups from SignalStar is done from the Import button in Manage Tests.
Application Sequencer Scripting Language
A scripting language has been added to the Application Sequencer, dramatically reducing the time to generate custom test sequences with the Sequencer. Application Sequencer files are now saved as .sqs files; which are text files that can be opened in a text editor.
In a text editor, the script can be modified rapidly to make more complex test sequences, create custom logic (using if/else logic statements) based on test status or external systems’ statuses (read through the Relay Card), change the currently executing test, change the test level, and more. The ability to edit the sequence files in the text editor make the Application Sequencer a powerful tool to automate an entire lab’s worth of equipment with the SignalCalc 900 software suite.
Extend Math Functions Across Multiple Channels
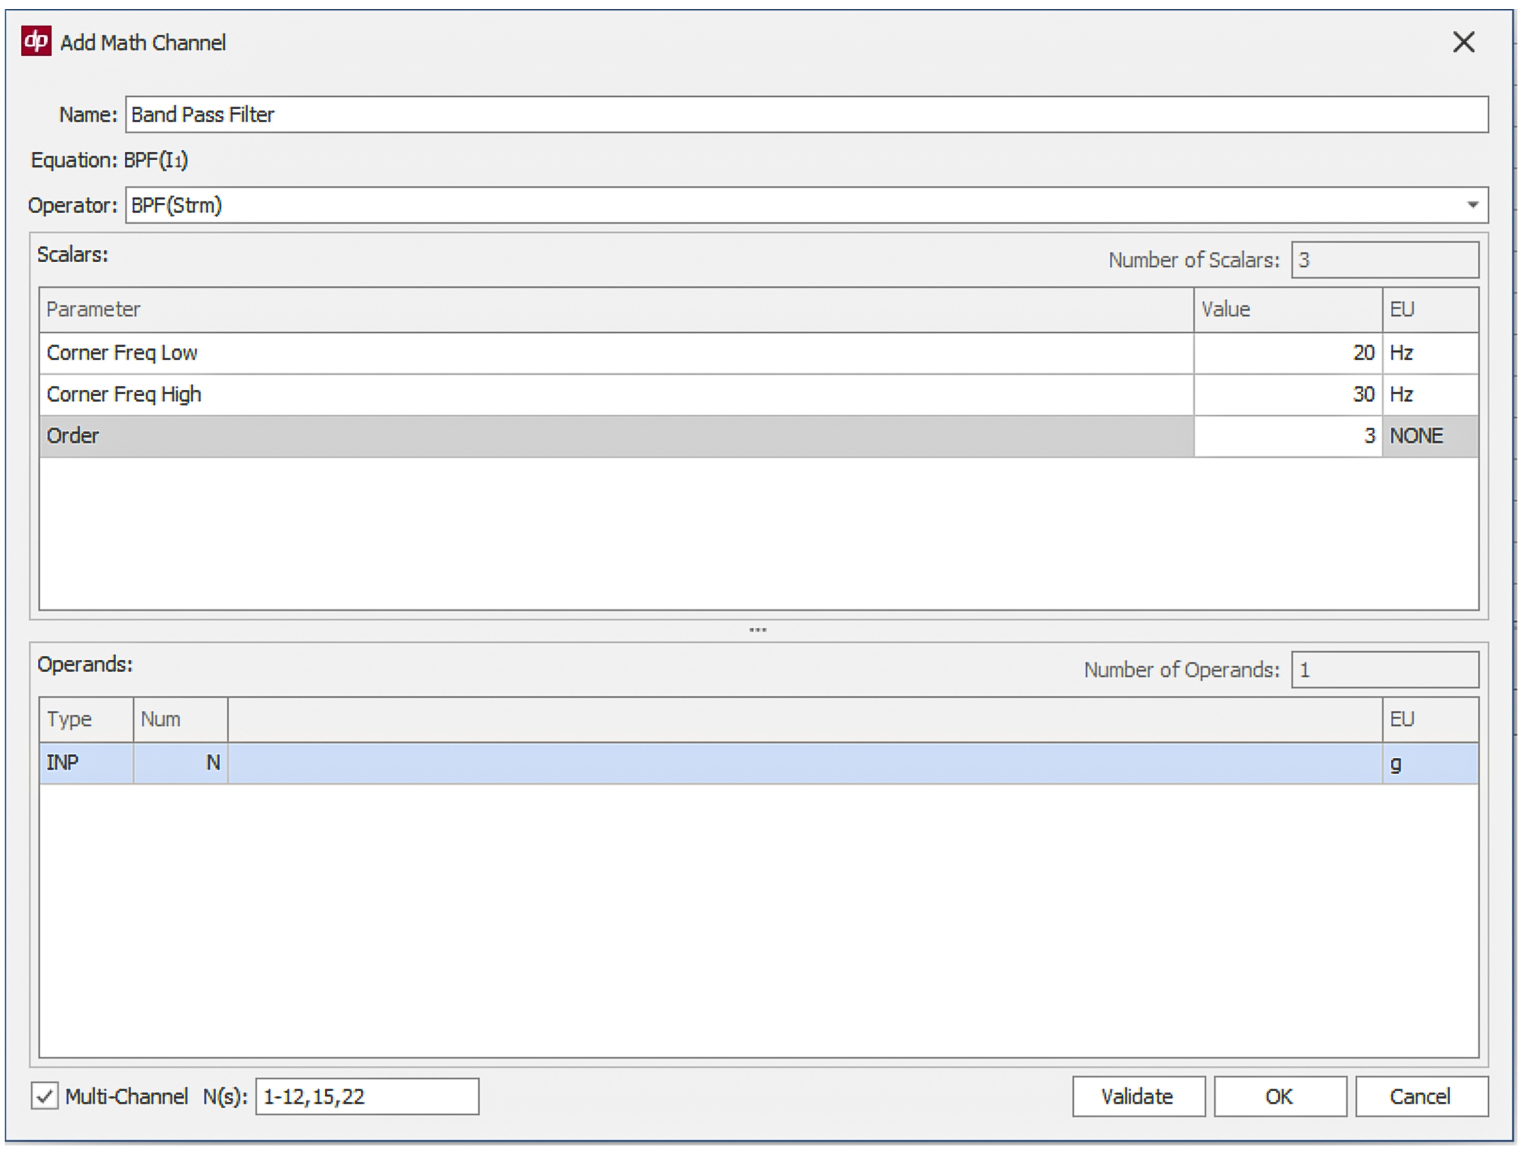
Now you can apply the same math equation to multiple channels automatically. Simply enable the multiple channels check box (as shown below) and indicate the desired channels. Use hyphen for continuation of channels or comma for specific channels.
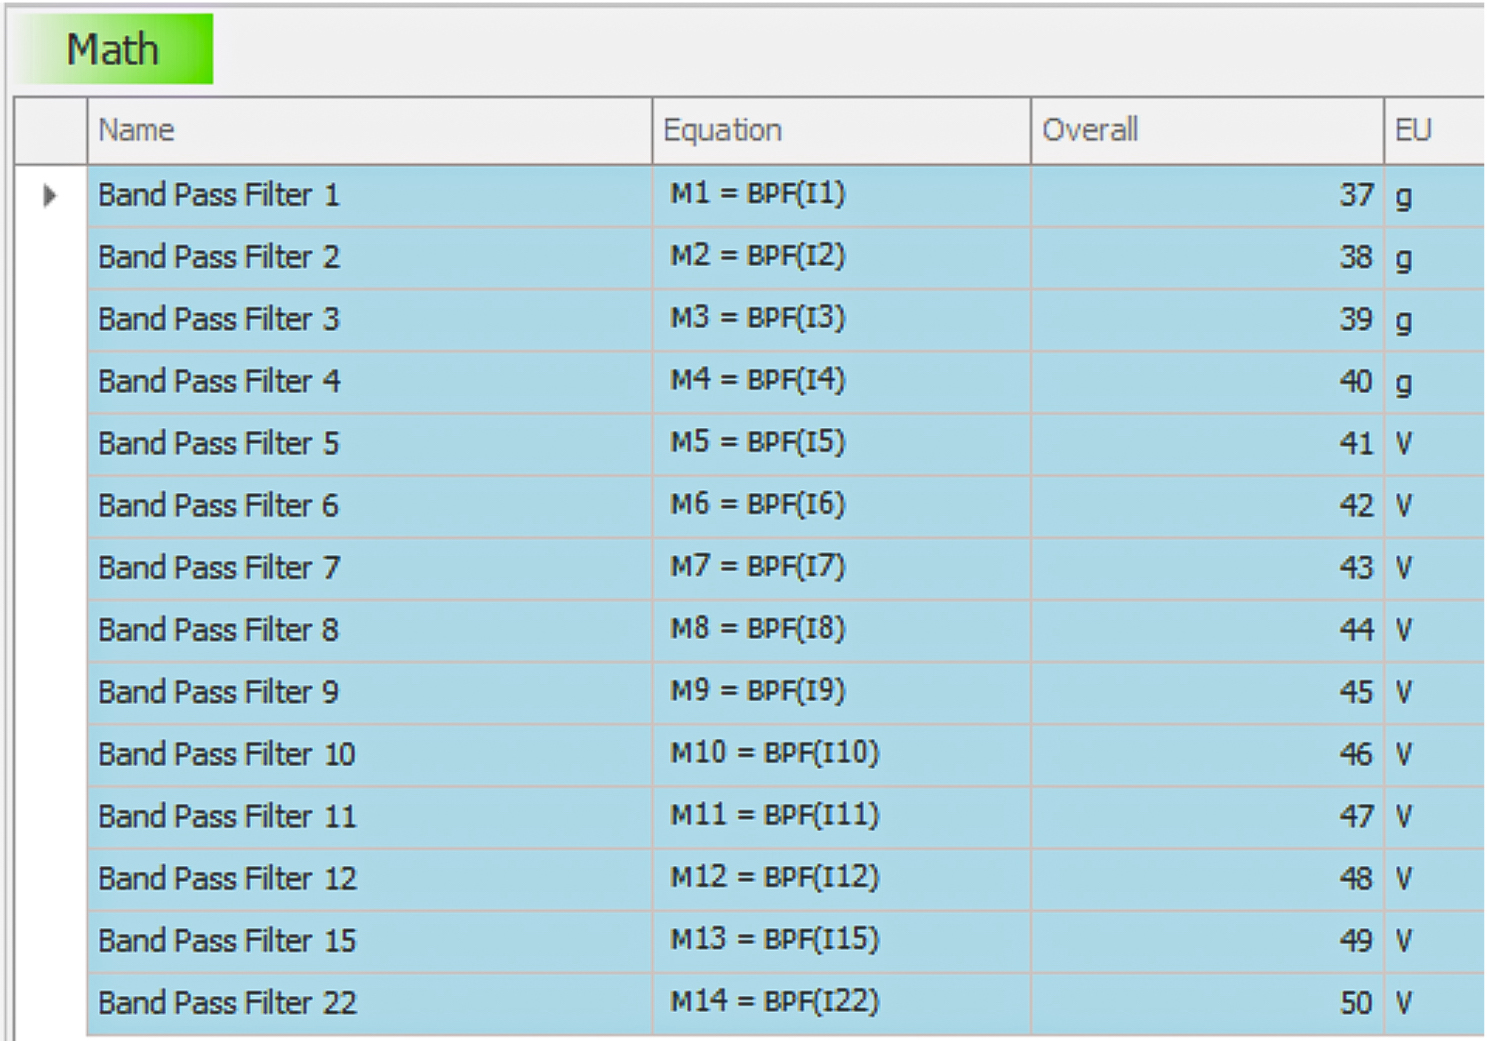
In the below example, the band pass filter is applied to channels 1 through 12, 15 and 22. The system highlights the math channels in blue, indicating that they are all grouped together. You can edit the math function and apply the change to all the channels or ungroup them to edit individual channels, if preferred. Note, ungrouped channels cannot be grouped together again.
Triggering External Systems at a Specific Point in a Vibration Control Test
The ability to send an output trigger/pulse at a very specific time has been added to the SignalCalc 900 Vibration Controller. This is a sample-accurate way to trigger/sync external systems at a specific time during the vibration test. For example, an external system can be triggered exactly when the Random test reaches 0dB, or right when a Shock test reaches 0dB.
This functionality is now in the Sine, Random, and Shock/SRS controllers.
Consolidate Data from Multiple Data Servers
The ability to merge databases has been added to SignalCalc 900.
This functionality moves all tests, runs, recordings, and attachments from one data server to another. This functionality is useful if two test stands have previously been running independent data servers, and you want to aggregate them to a single data server.
Improvements to Data Servers, 900 System Distribution, and Networks
Enhancements have been added to SignalCalc 900 which lower the Network requirements for a single Data Server to be used by multiple test stands.
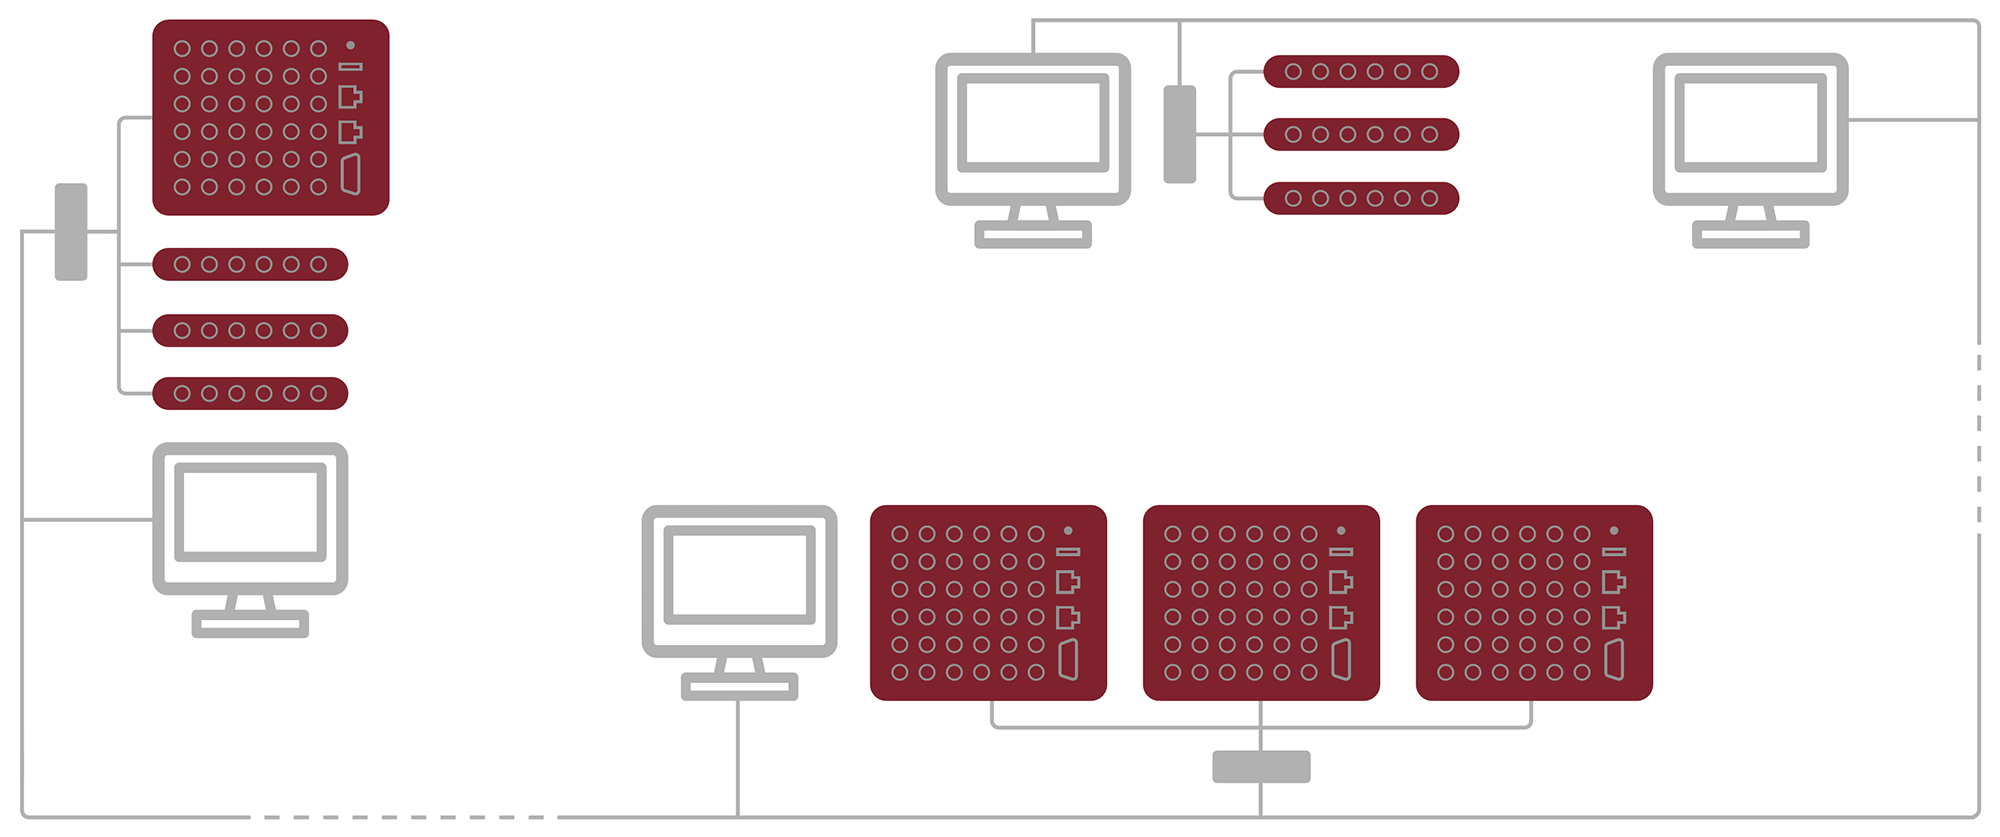
Now, a Data Server which stores data from one or multiple 900 system test stands can be on one network; while the 900 Systems are on a separate network. The host PC being used to drive the 900 Series Hardware needs to be connected to both networks; however, the 900 Series hardware and the Data Server do not need to be on the same network.
In addition, enhancements have been made which improve the performance of data transfers and reviews when running on a network which is slow or has delays.
Trace Color Management
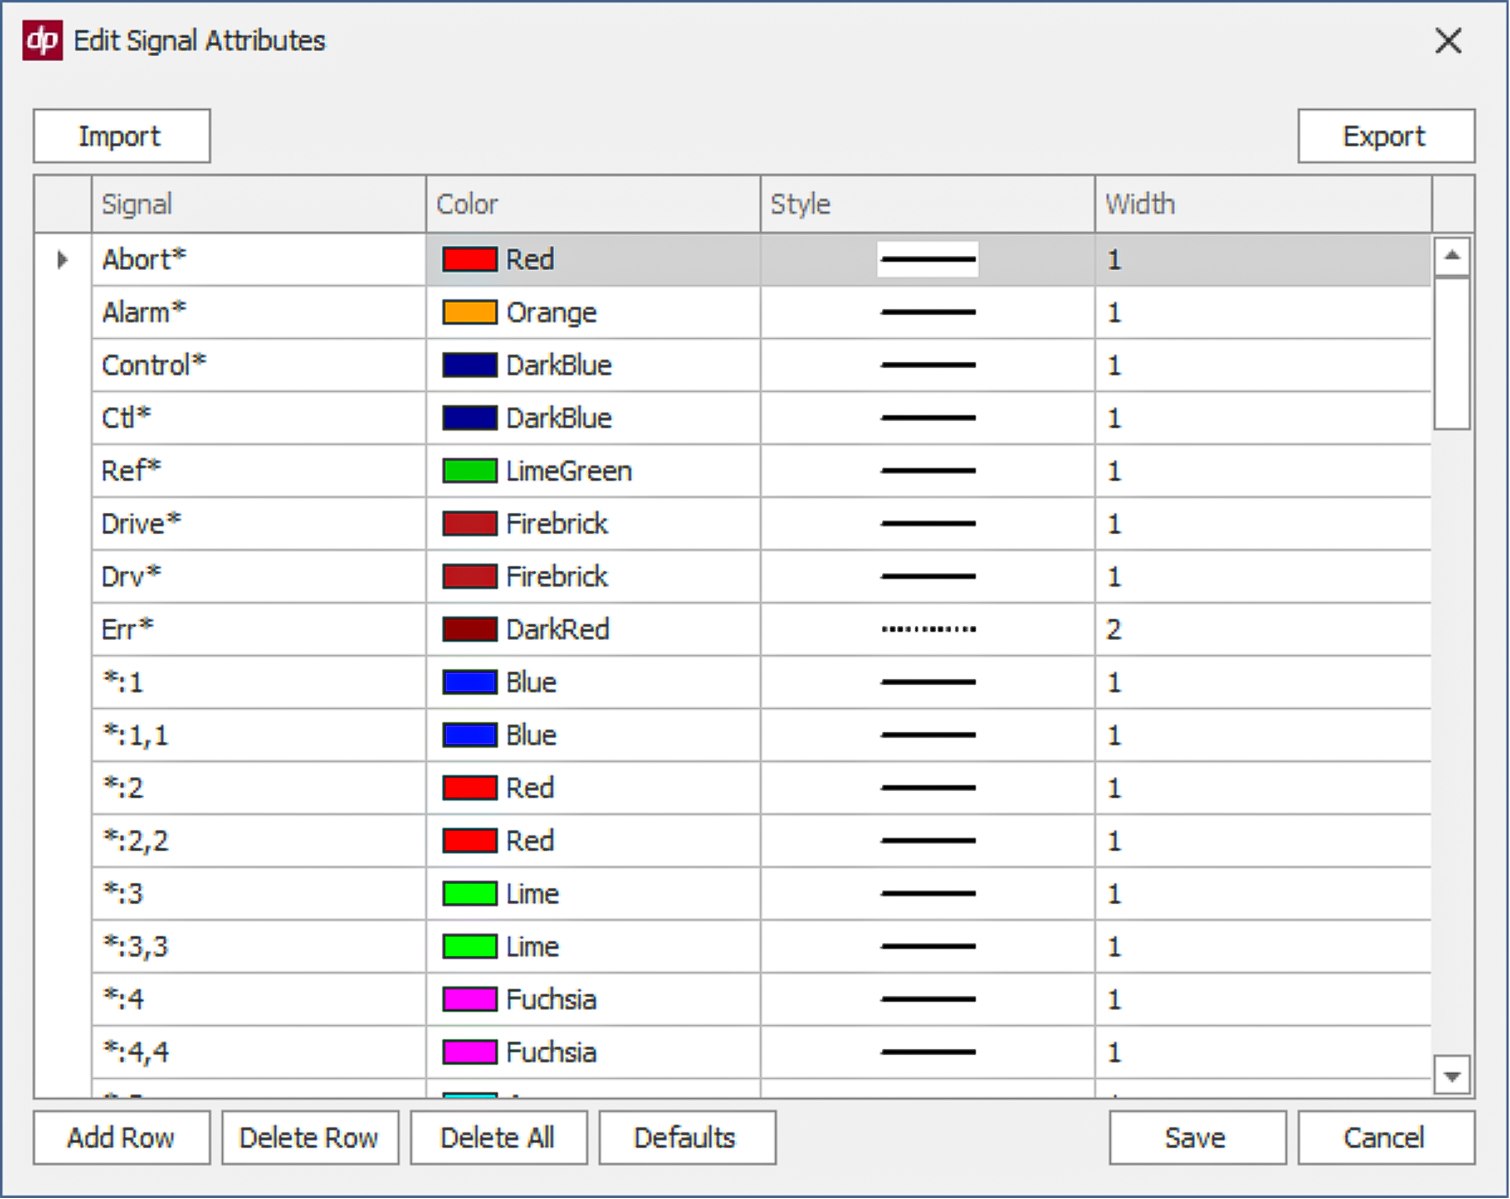
Trace colors now have an automated method to select their colors, which can eliminate the need to individually select colors for specific traces. The Trace Color Manager allows the user to define default colors for traces; for example, assigning the same color to the same channel number (for Time, Frequency, SRS plots) or assigning Green to a reference signal and Red to a tolerance signal. This can reduce the number of clicks to bring up a properly colored Control/Alarm/Abort/Reference plot to just a few clicks.
The Trace Color Manager is accessed from the DP Menu’s Edit Signal Attributes menu. It is applied with the Signal Selector’s “Colors” button.
Improvements to the Application Interface (REST Interface)
Many new functions have been added to the Application (REST) Interface. This dramatically increases the functionality of the automation interface and allows for more custom automation interfaces.
These added functions include:
- Changing an output signal’s frequency/phase/amplitude live during a test
- Change the level (or stage) of a vibration control test live during test.
- Ability to create new tests and configure their test parameters
- Get a list of all tests in the database
Along with the existing ability to open/execute tests and grab live data, the automation possibilities with the REST interface are unlimited.
Time History Recording Linked to Primary Measurement
The ability to link a time history recording’s Start/Stop with an existing measurement’s start/stop has been added. The time history recording still has its own Start/Stop button; but now in addition it can also automatically start/stop when the primary measurement starts or stops.
With this function, if a vibration control test is running, the time history recording can automatically stop when the test stops; restart when the test restarts; etc.
Complete Data Management for all your 900 Series Instruments
The 900 Series software’s data management system is built on an SQL database. It stores your data in a searchable, relational database which can be used by multiple Computers and 900 Series instruments.
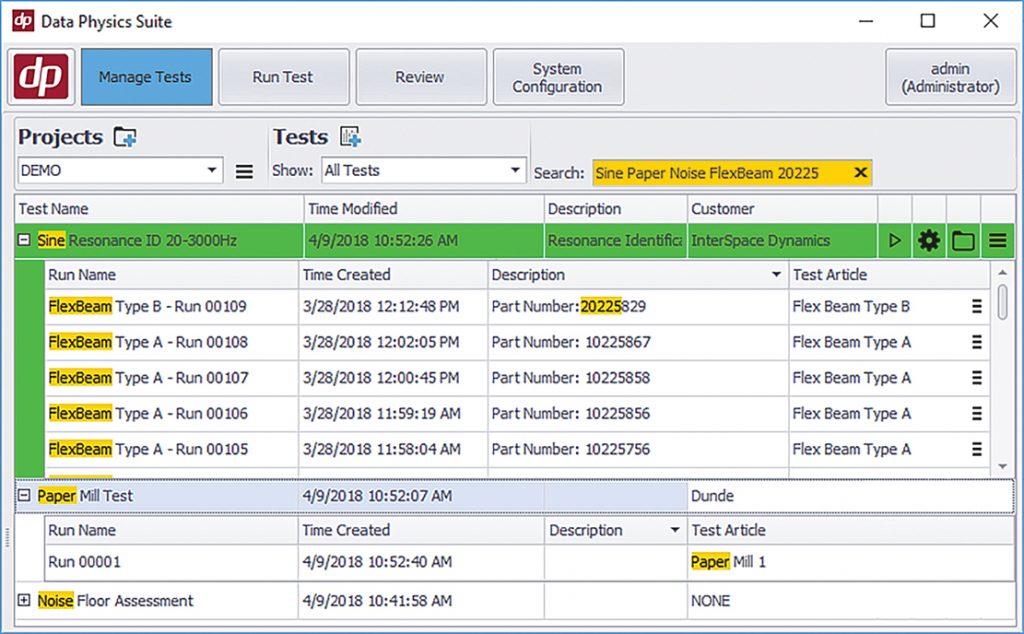
Search, Sort, and Filter
Data Aggregation
Multiple PCs and 900 Series hardware units can share the same test database – automatically aggregating all data onto a single data server
Designed for Large Databases
Easy Export
Seamless Data Sharing
Any networked PC can run the SignalCalc 900 software and connect to the Database, review data, and generate reports
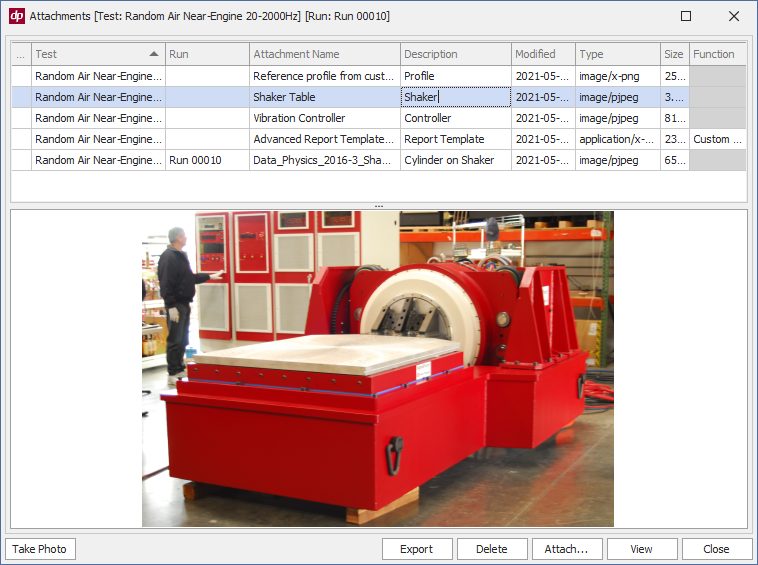
Attach Images or Digital Files to Tests or Runs
The 900 Series software’s Allows digital media such as images to be attached to a specific test or a run – eliminating the need to create a separate Windows file archive of photos and notes which parallel your test data
Take or Import a Photo
Take a Photo from a camera attached to the PC, or import from a file on your PC
Automatic Archiving in Database
Attached image is archived in the test database, along with the test setup or data
Include Images in Reports
Images can be automatically placed in reports – both standard and custom reports
Attach to a Project, Test, or Run
Images can be attached to a Project, Test, or Run and are inherited by all sub-tests or runs
Auto-Generate Custom Reports
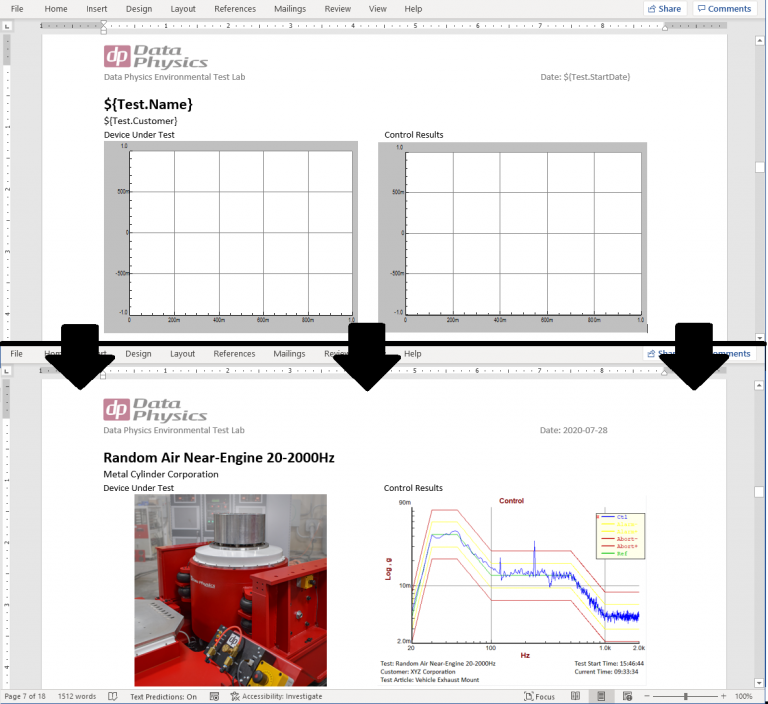
Attach Word (*.docx) report templates to a test and it will be populated with the resulting test data/images /parameters – automatically creating multiple reports with custom formatting at the end of the test
Custom Reports in Your Format
Create Templates in Word
Create a report template in Microsoft Word and have SignalCalc 900 populate the report parameters, plots, and images automatically after each test (DP900-68)
Include formatted plots
Plots can be placed anywhere in a Custom Report – using a placeholder image and a metadata tag that tells the software which plot to replace the placeholder with. The plots are dynamically resized based on the size of the placeholder image.
Place Test Parameters Anywhere
Test parameters and statuses such as Test Time or Control Level can be placed in the form of $variables anywhere in your Word template file.
Include Attached Images
Images can be placed anywhere in a Custom Report Template in the same way as a Plot – with a placeholder sized the way you want it.
Generate Reports Anywhere
Generate Reports on the PC that conducted the test, or on any networked PC
Data Plotting and Review
The 900 Series software has a fully integrated 2D and 3D plotting system which allows you to customize plots the way you want to see them.
Custom Plots
Customize every aspect of your plots from scaling to units to fonts
Tabbed Layouts and Multi-Monitor Support
Plot layouts are saved in Tabs (pages) which can be undocked and made full screen on secondary monitors
Data Overlay
Data from any test can be quickly overlaid with the Multi-Select function – both live during test or during data Review
Streamlined Plot Generation
When bringing up new traces and plots, SignalCalc 900 includes tools to easily display and format them to your liking
Trace Color Management
Trace colors now have an automated method to select their colors, which can eliminate the need to individually select colors for specific traces. The Trace Color Manager allows the user to define default colors for traces; for example, assigning the same color to the same channel number (for Time, Frequency, SRS plots) or assigning Green to a reference signal and Red to a tolerance signal. This can reduce the number of clicks to bring up a properly colored Control/Alarm/Abort/Reference plot to just a few clicks.
Trace Color Manager is accessed from the DP Menu’s Edit Signal Attributes menu and applied with the Signal Selector’s “Colors” button.

