The Fast Fourier Transform (FFT) Converts Dynamic Signals from the Time Domain to the Frequency Domain, Enabling Engineers and Technicians to Analyze and Understand Signal Frequency Content
Used extensively in industries such as aerospace, automotive, defense, power and process, and manufacturing, the FFT serves as a primary tool for applications where vibration and other dynamic measurements are made including acceptance testing, vibration surveys, model validation, and troubleshooting and diagnostics.
Providing a valuable set of fundamental measurement capabilities, the FFT Dynamic Signal Analysis package with 900 Series hardware delivers a powerful range of functions for fast, accurate, and easy-to-use time and frequency domain measurements.
Input, output (DAC), and tach triggers for versatile data capture
Data Saves and Exports
Customize data saves and exports to be based on time, frames, averages, or more
Advanced Hardware and Network Connectivity
Form Factor
Rugged, lightweight, and portable for field applications
Standalone Operation
Data capture, processing, and storage without a PC
Sampling Rates
Up to 216 kSamples/sec
Frequency Resolution
Up to 51,200 lines of resolution for Isolation of closely spaced frequency content values
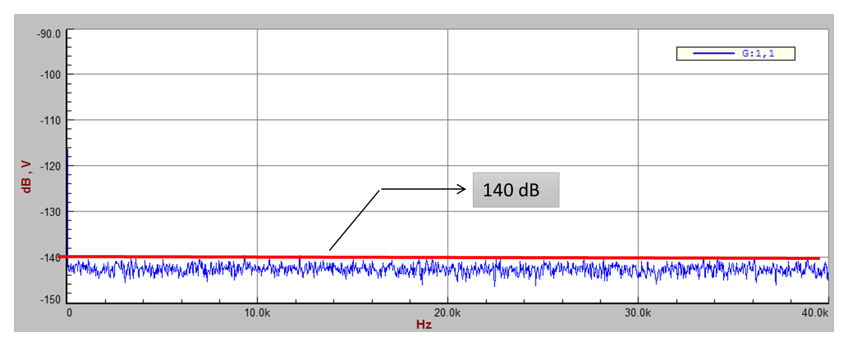
High Dynamic Range
Up to 140 dB for effective measurement of low amplitude signals
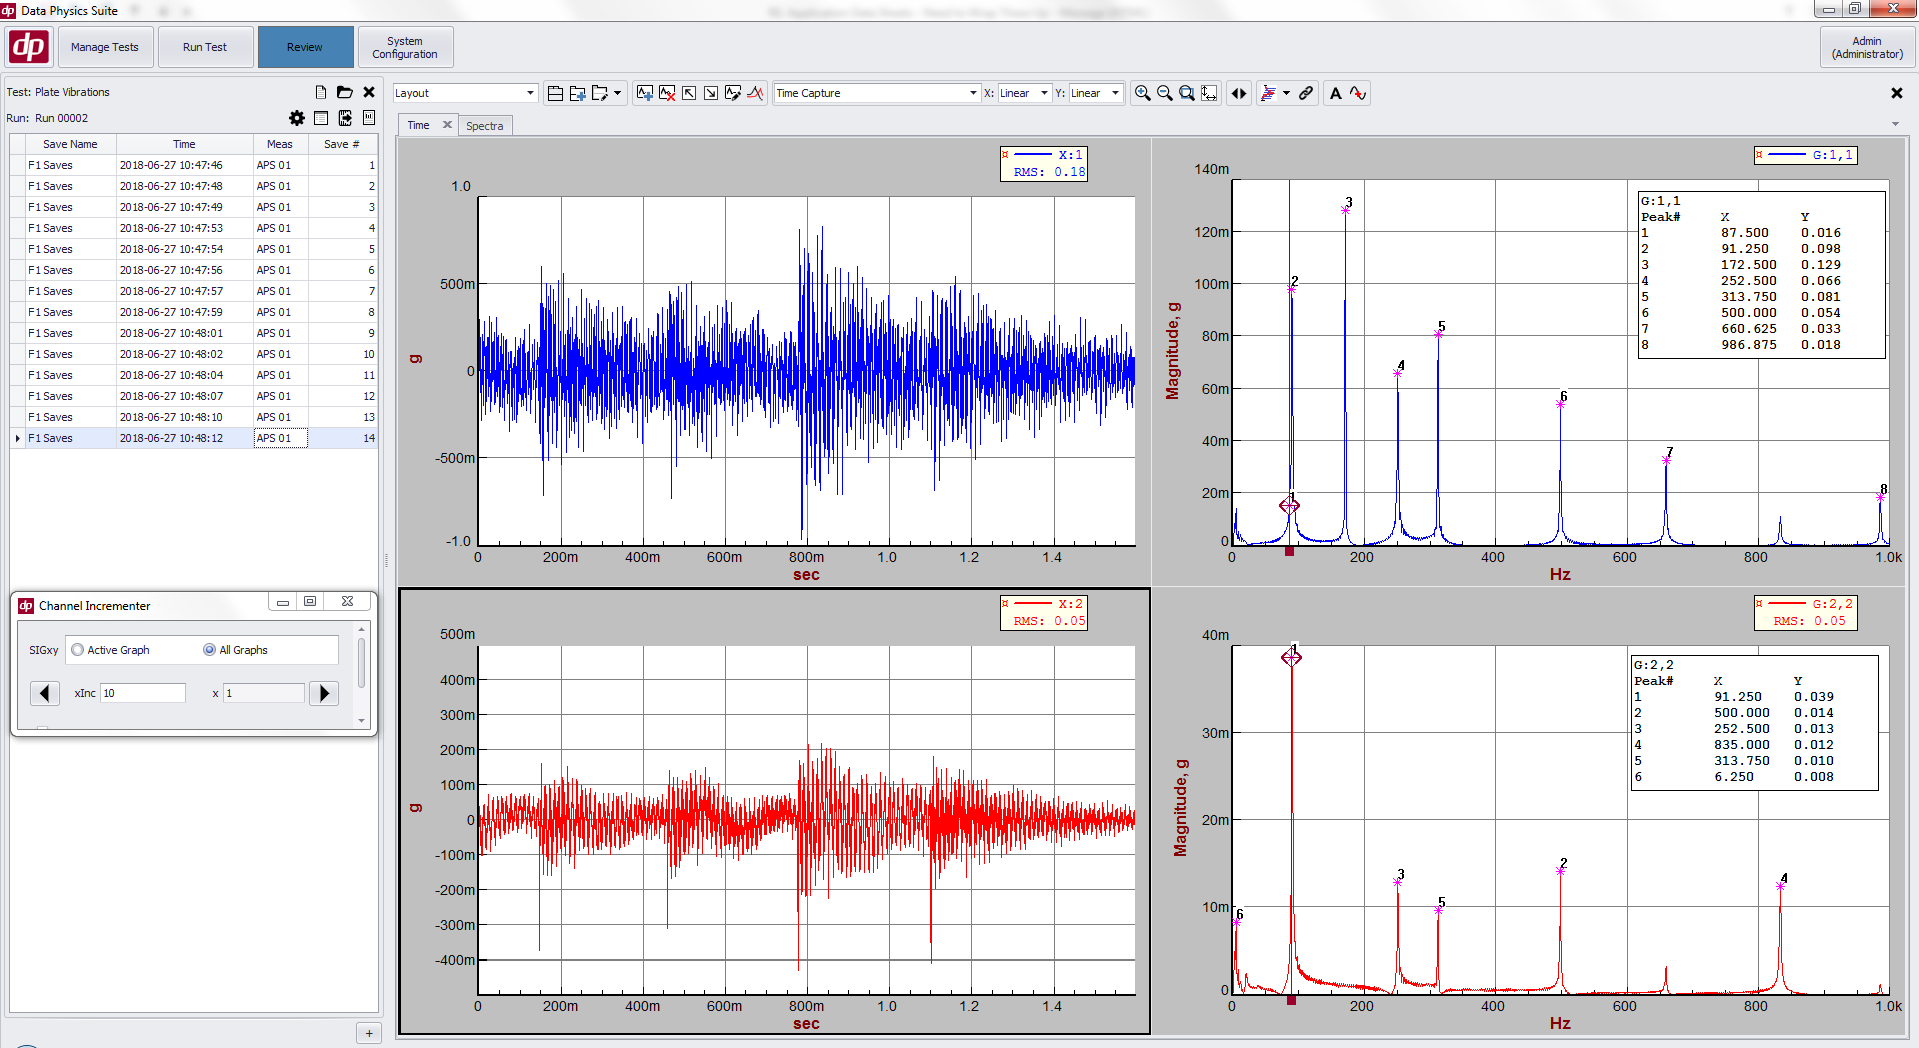
Time/Phase Synchronized Data Acquisition
All acquired data synchronized to within 0.5deg @ 40kHz even across multiple chassis with thousands of channels
Real Time Data Processing
Data sampled, re-sampled, processed, and stored live during acquisition with or without PC
Click to enlarge
Custom Reports and Data Review/Export
Fully Customizable Plots
Include readouts including test parameters, customer and test article name, operator, test time, etc
Overlay Data
Data from one or more runs/saves can be overlaid in Review Mode within seconds. The overlaid plots can be placed in a report.
Data Export
Data can be exported automatically during or after a test
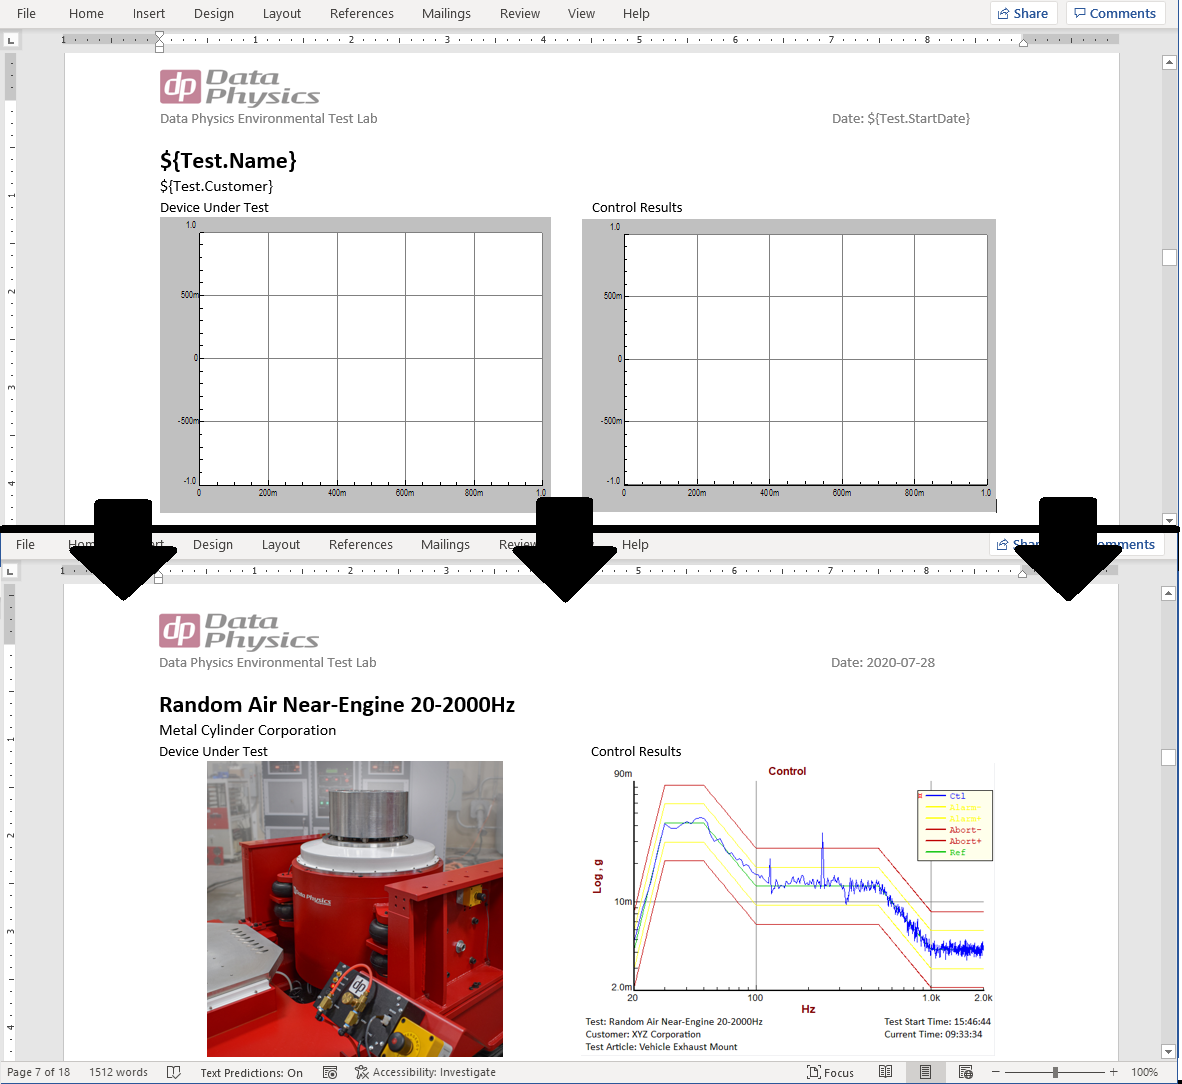
Create Custom Report Templates in Word
Create a report template in Microsoft Word and have SignalCalc 900 populate the report parameters, plots, and images automatically after each test (DP900-68)
Images and Media
Attach images of the test article or setup and have them printed in the report
Generate Reports Anywhere
Generate Reports on the PC that conducted the test, or on any networked PC
Efficient Testing, Analysis, and Reporting
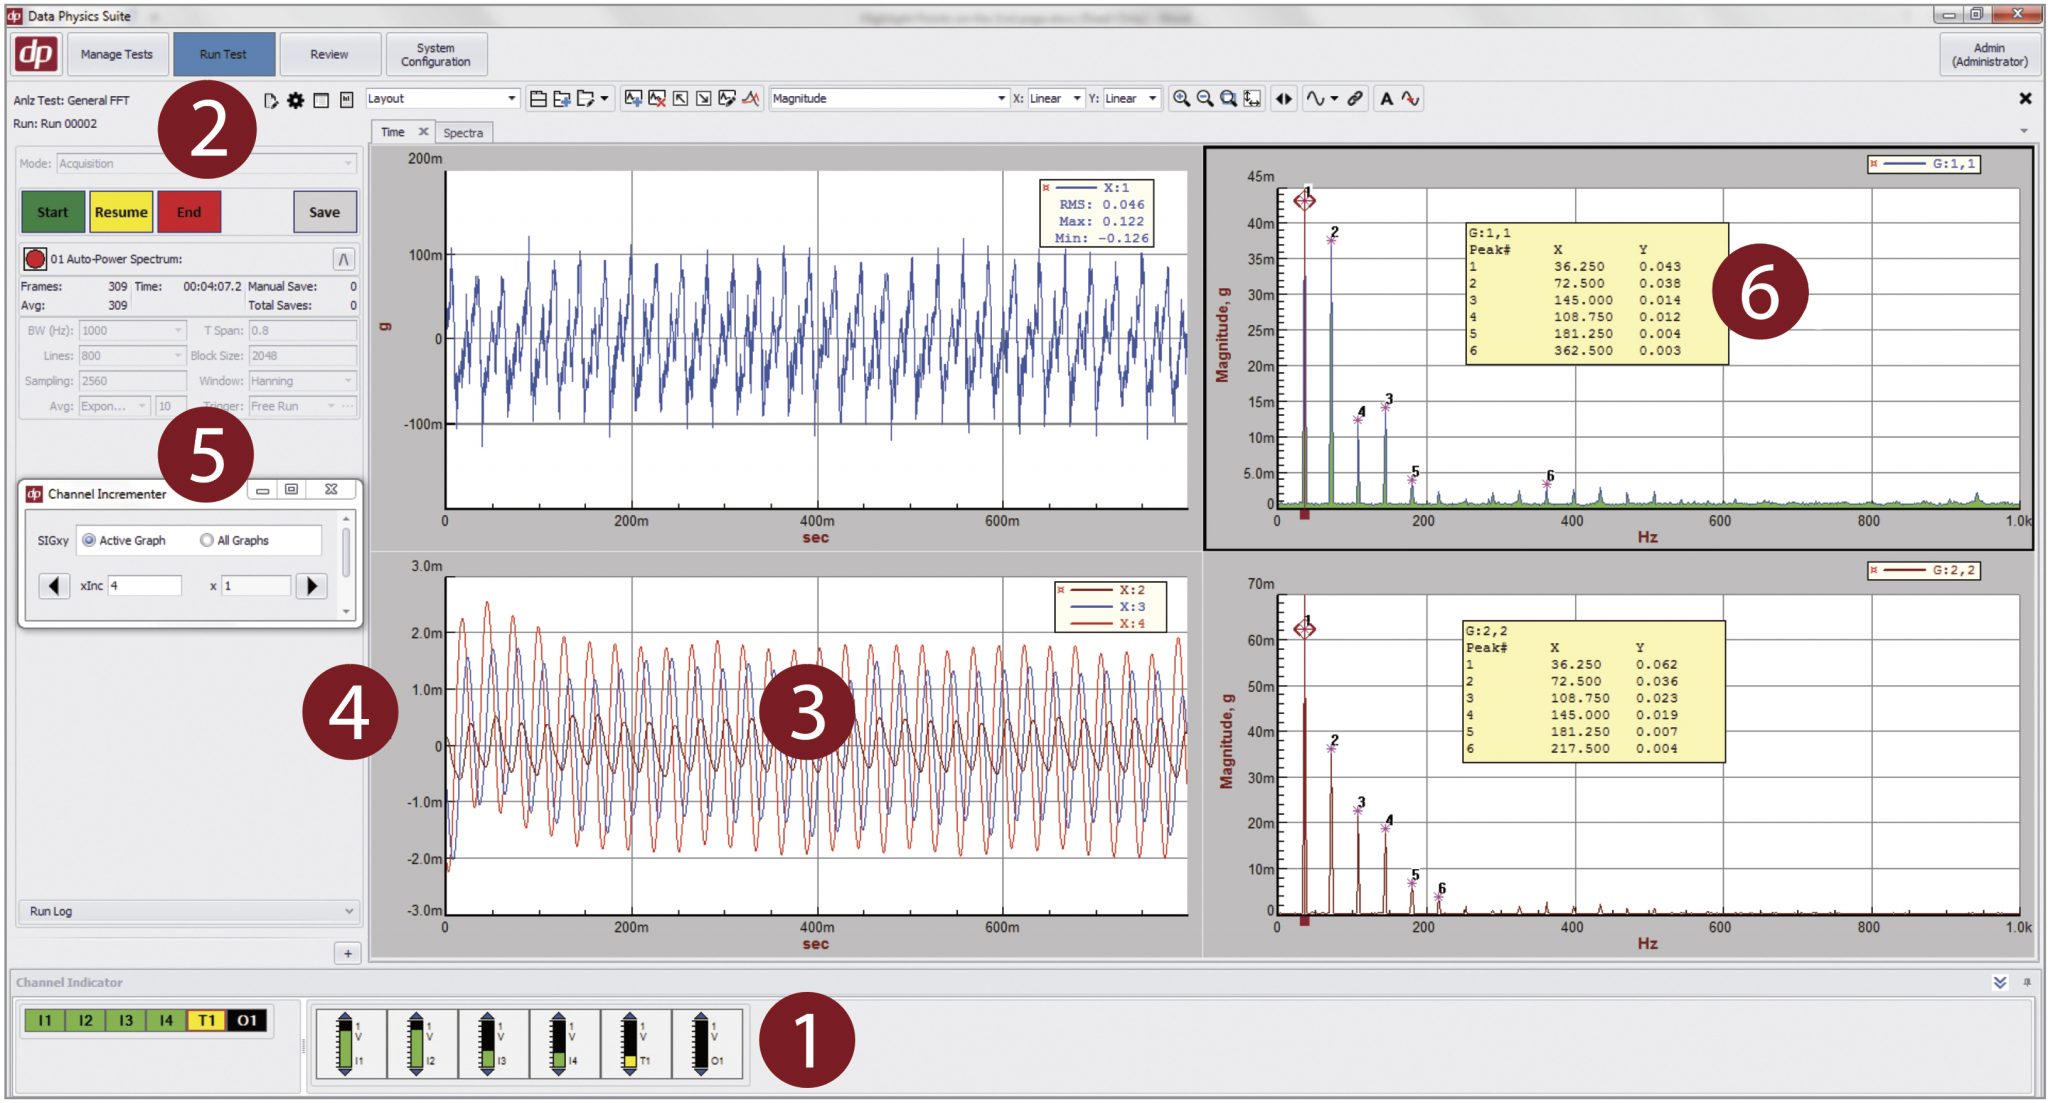
1 Channel Indicators
Easily monitor signal strength across all channels; green indicates good, yellow indicates low, and red indicates overload.
2 Compatible Export Option
Export data to Excel/ASCII, Matlab, UFF, ME’scope.
3 Review and Overlay Signal
Compare and contrast signals from different Tests/Runs/Saves; construct waterfall plots from individual saves in Review Mode.
4 Integration and Differentiation
Compute velocity or displacement from acceleration, and vice-versa; optional HighPass Filter before Integration is available.
5 Channel Incrementor
Conveniently increment current graph or all graphs to the next set of channels.
6 RMS and Peak Value Displays
Annotate graphs with important data values; copy all data on the graph or just Peak values to paste into Excel.