To effectively understand dynamic signal analyzers and vibration controllers, this article aims to describe basic dynamic signal analysis concepts. Many dynamic data processing techniques involve transforming the data to the frequency domain for better interpretation.
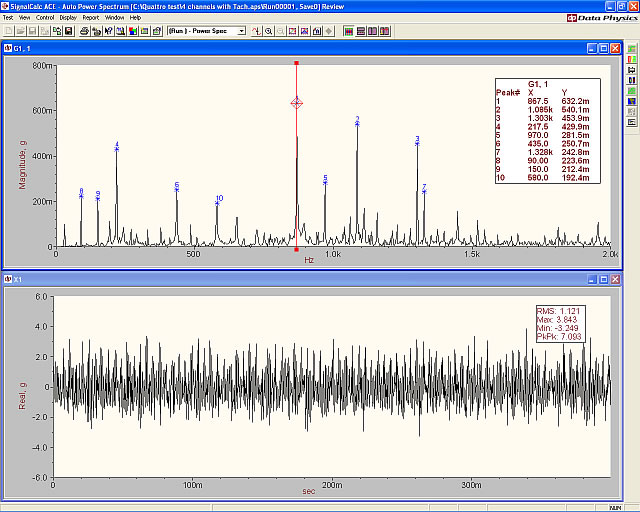
While much information can be gained from analyzing time data, there are many cases when time data analysis is insufficient. In these cases, the frequency domain may provide a much clearer picture for interpreting the data. In fact, most dynamic test data is best seen in the frequency domain. As an example, the following time signal (bottom trace) yields very little information of significance but the corresponding frequency data (top trace) is much more telling.

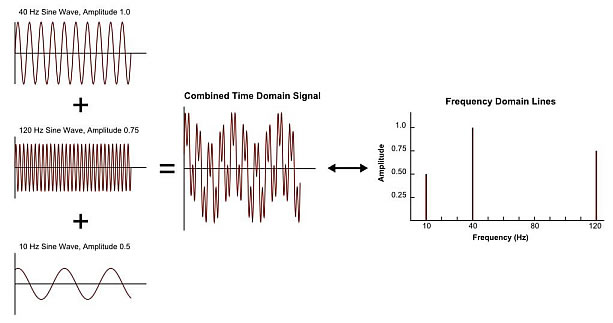
All periodic real world signals can be represented by a combination of sinusoidal signals. The Fourier transform takes a time waveform to the frequency domain. In the frequency domain, amplitudes and relative phase angles of the individual sinusoidal signals can be observed. The following illustration shows how three individual sine waves can be combined to form a complex time signal, as well as how that signal appears in the frequency domain.

What is The Fourier Transform Used For?
The Fourier transform is computationally intensive and would take too long to compute if not for the development of the Fast Fourier Transform or FFT. Today, the FFT is used universally for converting time domain data to the frequency domain. The inverse FFT is used to convert the frequency domain data back to the time domain.
The relationships between basic parameters of the time domain and frequency domain are easy to understand and provide a useful basis for selecting analysis ranges.


This conclusion that frequency resolution, change in f, is the reciprocal of capture length, T, is a fundamental fact of physics and can never be violated. In other words it is impossible to observe the frequency domain with fine resolution without observing the time signal for a very long time.
Fortunately, SignalCalc analyzers make it very easy to select measurement parameters; the user may select to set time domain or frequency domain parameters and the other domain is automatically calculated and displayed. That means a user may select the frequency domain parameters of Fspan and number of lines and the analyzer calculates and displays the corresponding Tspan and sampling interval.
This is one of many features that lends to the ease of use of the SignalCalc GUI. Additionally, all SignalCalc analyzers have the option of 51,200 frequency lines. Using a high number of spectral lines becomes extremely useful at high frequencies, and for occasional applications that require extremely fine frequency spacing.

