This is part one in a series of articles about how to evaluate the quality of a vibration control system. In each we will present important features of the control system and methods to measure the performance. In this article we will look at swept sine performance and show some simple tests that can be run using the SignalCalc analyzer. We will look at sine measurement options, tracking filter performance, and a simple method to determine if the controller produces a continuous swept sine that is not stepped in frequency.
Measurement Options for Sine Vibration Control Tests:
During a sine vibration control test the user can select the method for measuring the control signal. All measurement methods express the result in terms of peak amplitude value of a sinusoid. When the control signal is a pure sine wave all will yield the same result. In practice, the measured signal is subject to noise and sometimes even distortion and is never a pure sine wave. The available measurement methods should include:
Peak – Peak measurement method picks the absolute value of the peak amplitude within each measurement frame. This technique is simple and fast, but can be strongly influenced by noise and distortion.
RMS – RMS measurement method evaluates the RMS value of an appropriate length of signal but expresses the result in terms of an equivalent peak value, assuming a pure sine wave. This measurement will capture the total power in the signal including any noise, harmonic distortion, and other forms of distortion.
Average – Average measurement method takes the average absolute value and expresses the result in terms of an equivalent peak value. Average processing is similar to the peak method but is less susceptible to noise.
DC – DC method is not a measurement of a sine wave at all. It simply measures the average amplitude on an input channel. It is commonly used to measure a “static” parameter versus sweep frequency.
Tracking Filter – Tracking filter method measures the output of a bandpass filter centered at the frequency of the sweeping sine wave and expresses it in terms of a peak value of a sine wave. The filter rejects out of band energy and is the only way to measure energy that belongs only to the sine wave. The amount of rejection is of course dependent on the bandwidth of the filter. The user selects the bandwidth and also whether it is proportional to the sine frequency or if it is of constant bandwidth. This is the only method that can measure the phase angle of the sine wave and is required if the test includes resonance tracking such as is used in fatigue testing.
Rejection of noise and harmonics results in a measurement of the single sine wave at the sweep frequency. In comparison, the inclusion of noise and harmonics causes the measured signal to be higher than the actual level at the sweep frequency, resulting in under testing.
Tracking Filter Quality:
Tracking filters should have selectable bandwidth to allow optimization for specific test requirements. A narrow bandwidth increases out of band rejection and minimizes noise. A narrower filter, however, has a longer time constant and the measurement will be affected by smearing due to the sine sweep. A compromise between sweep rate and filter time constant is required.
Two types of digital tracking filters are used: fixed bandwidth and proportional bandwidth. A fixed tracking filter bandwidth is specified in Hz while a proportional tracking filter is specified as a percentage of the tracking frequency. A fixed bandwidth filter may give incorrect measurements at low frequencies if the time constant of the filter is less than the length of a period of the sine wave. Conversely, a proportional bandwidth filter may give measurements affected by noise at high frequencies if the time constant includes too few samples. In SignalStar controllers, users do not have to worry about inaccuracies because the system uses ‘smart’ filters to guard against these circumstances.
A Simple Tracking Filter Test

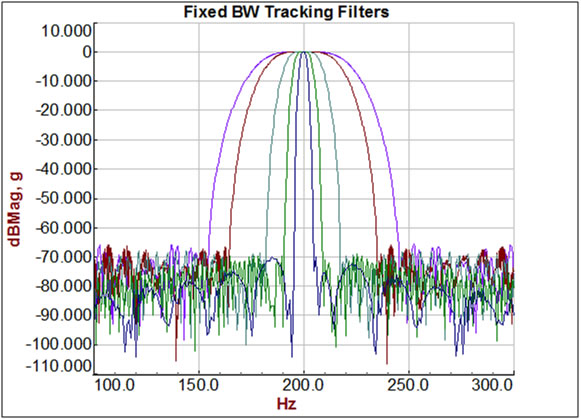
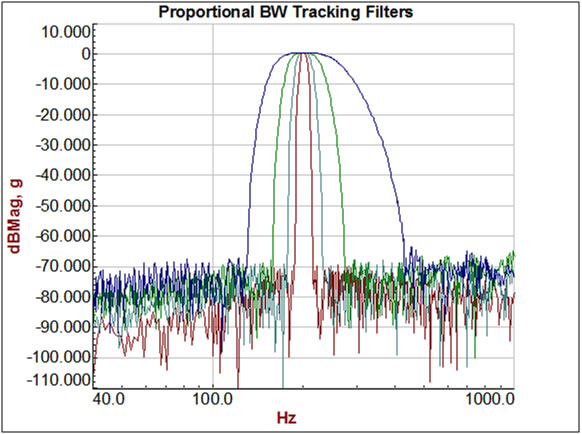
The tracking filter characteristics of a sine control system can be easily characterized using an external signal generator to generate a constant sine wave, in effect inverting the measurement process. Instead of measuring the width of a tracking sine wave you measure the rejection of a constant frequency sine wave. By providing a constant frequency sine wave into a measurement channel of the control system, the shape of the tracking filter can be seen and the out of band rejection can be quantified. The measurement on this channel is an envelope of the tracking filter shape. A diagram of this test is shown above.
The following graphs show the results of this test on the SignalStar Vector control system using different bandwidth with fixed and proportional tracking filters. The results show a flat pass band, sharp filter roll-off and approximately 70 dB of out of band rejection.


Continuous Sine Sweep:
Another important quality of a swept sine controller is the ability to produce a continuous analog swept sine, ensuring that all frequencies within the sweep frequency range are excited. Some companies use a stepped sine. Using a stepped sine can result in not exciting all of the frequencies within the sweep frequency range and discontinuities in the drive signal. Using the SignalCalc analyzer and the tachometer channel, there is a simple test to verify the quality of a swept sine. Connect the controller to the SignalCalc analyzer as shown in the diagram below.

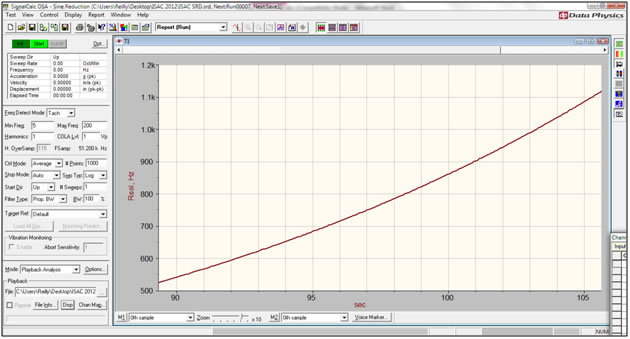
Using an RPM based measurement in the analyzer you can record the drive, control, or COLA signal to disk. After the test a display of RPM versus time graph will allow you to see if there is any stepping of the sine frequency. It will appear as a “stair step” in the tachometer versus time graph and be more pronounced at low frequency during a logarithmic sweep. The graph below shows an example of a good continuous swept sine, as measured with the tachometer.


