
Shock Response Spectrum (Srs) analysis
Streamlined Transient Capture and SRS Analysis in SignalCalc 900
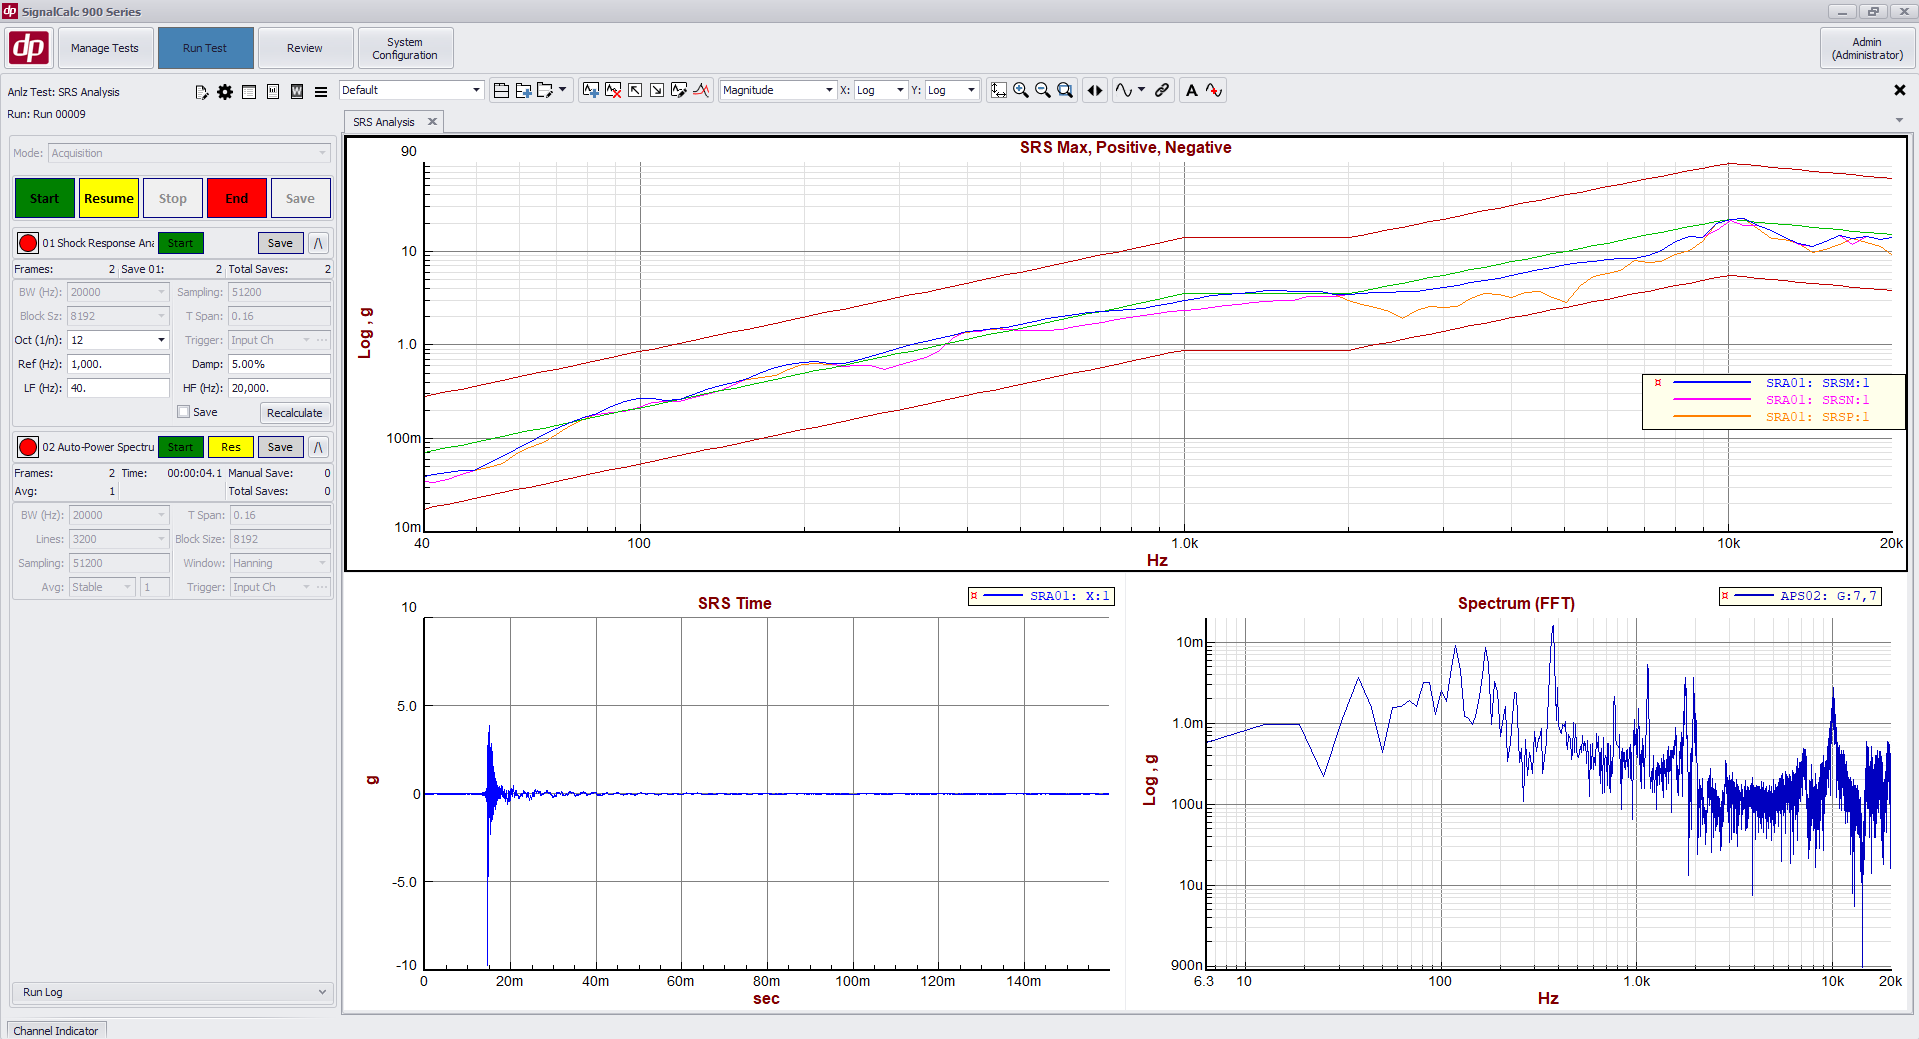
Shock Response Spectrum analyzes the damaging ability of a transient pulse by estimating its effect on resonances. SignalCalc 900 uses a trigger to capture transient pulses – and a single transient capture may be reanalyzed multiple times live during the test using different damping factors, octave spacing, or octave placement.
SRS Measurements
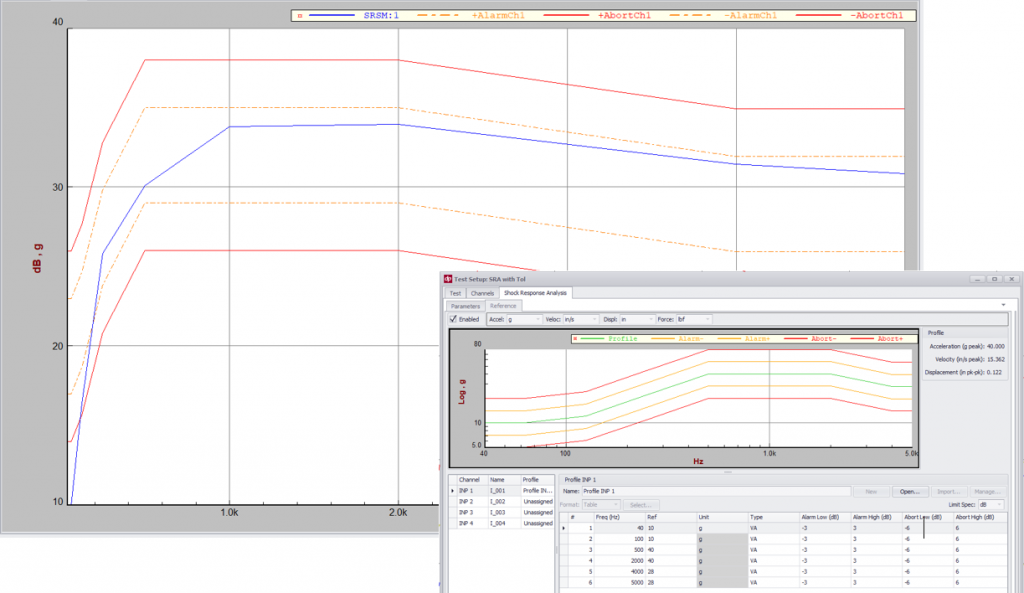
Tolerance Bands
Enter Tolerance bands for pass/fail error checking
Input Ranges up to 30 Volts
Capture high amplitude shock events without clipping the input signal
High Quality Linear Phase Filters
Eliminate distortion of transient signals due to filtering
Sample Rates up to 200 kHz
Accurate measurement of high frequency shock events
Live Manipulation of Analysis Parameters
SRS type, octave spacing and critical damping percentage can be modified to recompute the SRS during the measurement
Integration/Differentiation of Captured Signals
Display data in acceleration, velocity and displacement
Advanced Analysis Capabilities
Recording and Playback Analysis
Record shock data and individually trigger and analyze individual shock events within the recording
Simultaneous Multi Measurement
Combine SRS analysis with other measurement types like FFTs to streamline data acquisition and SRS analytics.
Custom Reports and Data Review/Export
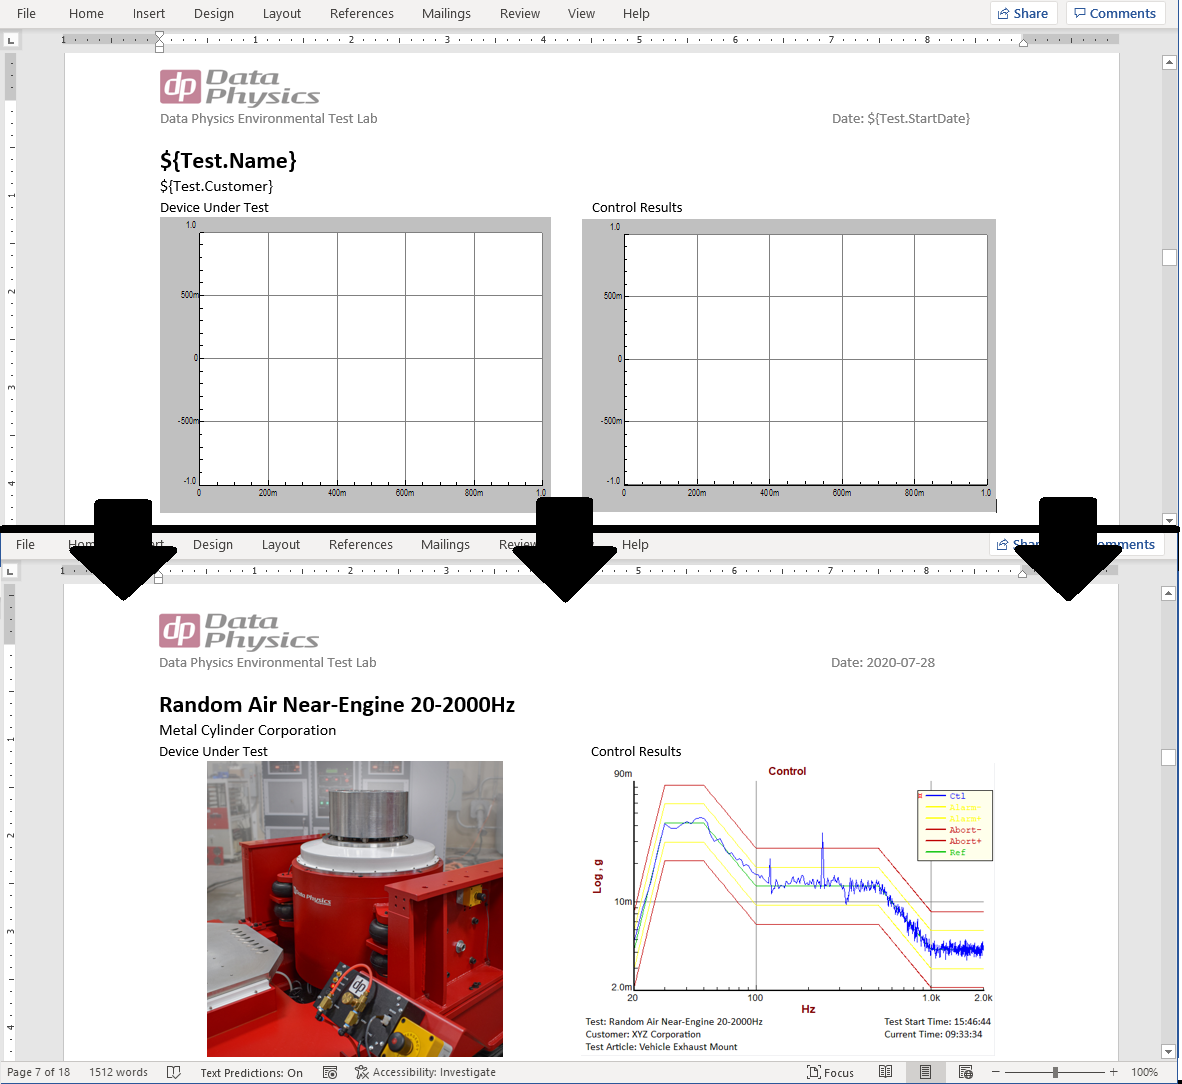
Fully Customizable Plots
Include readouts including test parameters, customer and test article name, operator, test time, etc
Overlay Data
Data from one or more runs/saves can be overlaid in Review Mode within seconds. The overlaid plots can be placed in a report.
Data Export
Data can be exported automatically during or after a test
Create Custom Report Templates in Word
Create a report template in Microsoft Word and have SignalCalc 900 populate the report parameters, plots, and images automatically after each test (DP900-68)
Images and Media
Attach images of the test article or setup and have them printed in the report
Generate Reports Anywhere
Generate Reports on the PC that conducted the test, or on any networked PC
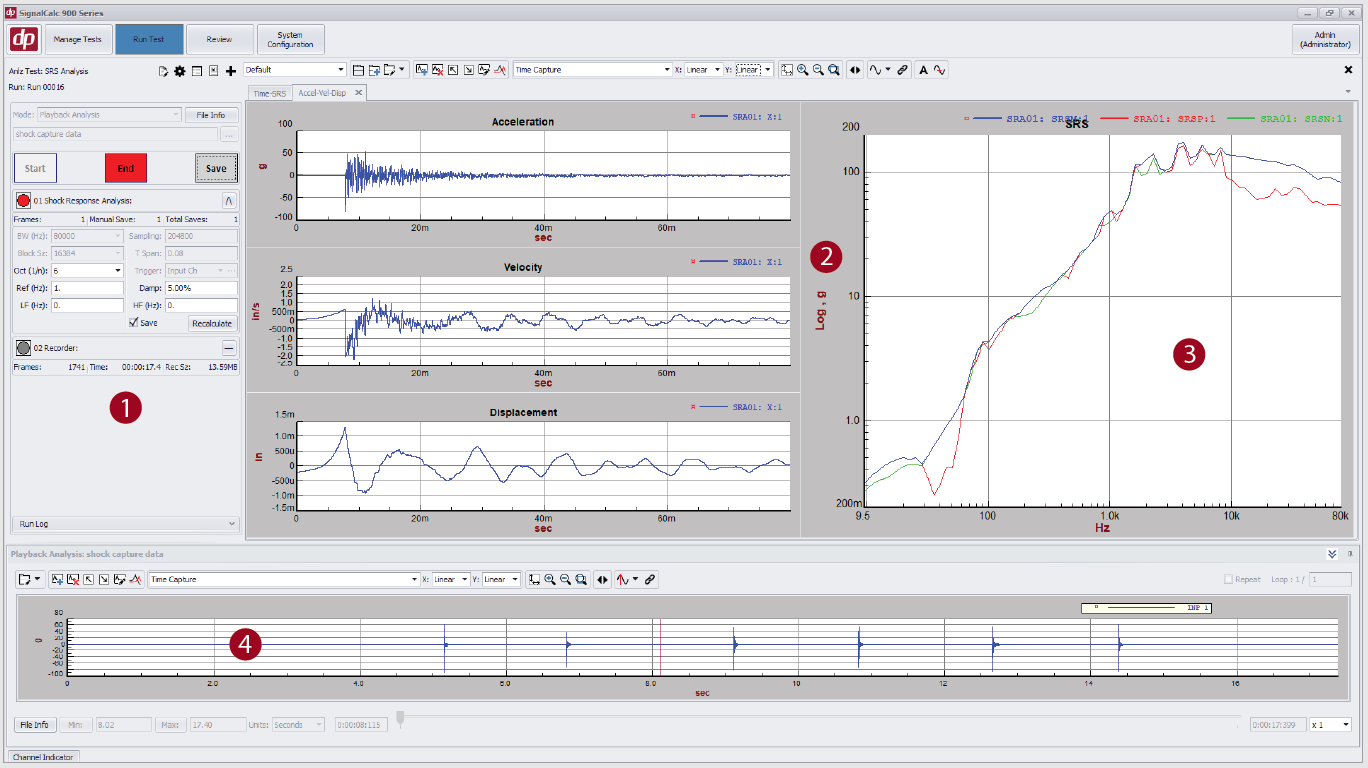
1 Test Control
Set triggering and measurement parameters from the data capture screen. SRS parameters can be changed and recalculated on the fly.
2 Live Data Display
View time and SRS data. Integrate and differentiate to display acceleration, velocity and displacement.
3 SRS Analysis
Positive, Negative, and Maxi-max Shock Response Synthesis signals with user-specified nth octave spacing and % critical damping.
4 Playback Analysis
Individually trigger and analyze individual shock events within time data recordings.